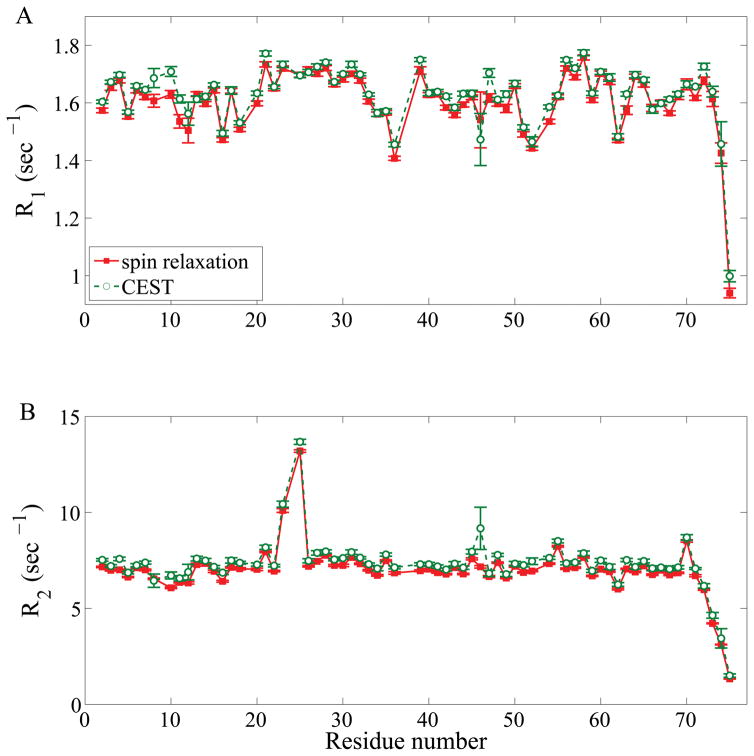
Figure 1.
Comparison of experimental relaxation parameters (A) R1 and (B) R2 of ubiquitin derived from CEST (green circles) and standard spin relaxation experiments (red squares) at 850 MHz magnetic field strength. Residue T9 is not shown due to substantial broadening of this peak at pH 7 resulting in a large uncertainty of its relaxation parameters.

