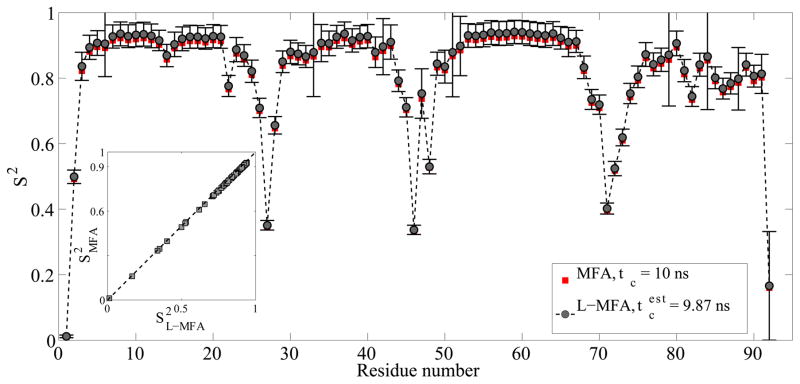
Figure 2.
Comparison of backbone N-H S2 order parameters obtained by L-MFA and MFA model-free analysis of the α-domain of ATPase (PDB 1QZM) based on NMR spin relaxation data computed from a 500 ns MD trajectory assuming a tumbling correlation time τc = 10 ns. An estimated τc = 9.87 ns based on the average R2/R1 ratio of residues in well-defined secondary structures was used for the L-MFA analysis. The inset shows a correlation plot of S2MFA vs. S2L-MFA with different τc values of 10 and 9.87 ns, respectively. The correlation coefficient between S2MFA and S2L-MFA is 1.00 and the RMS error is 0.012.

