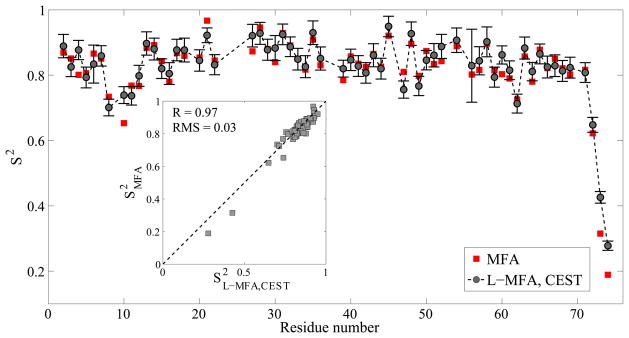
Figure 3.
Comparison of experimental ubiquitin order parameters S2MFA determined from R1, R2 and NOE data of standard spin relaxation experiments (red squares) and S2L-MFA determined from CEST-derived R1, R2 values (black circles). The insets show scatter plots for the two types of order parameters.

