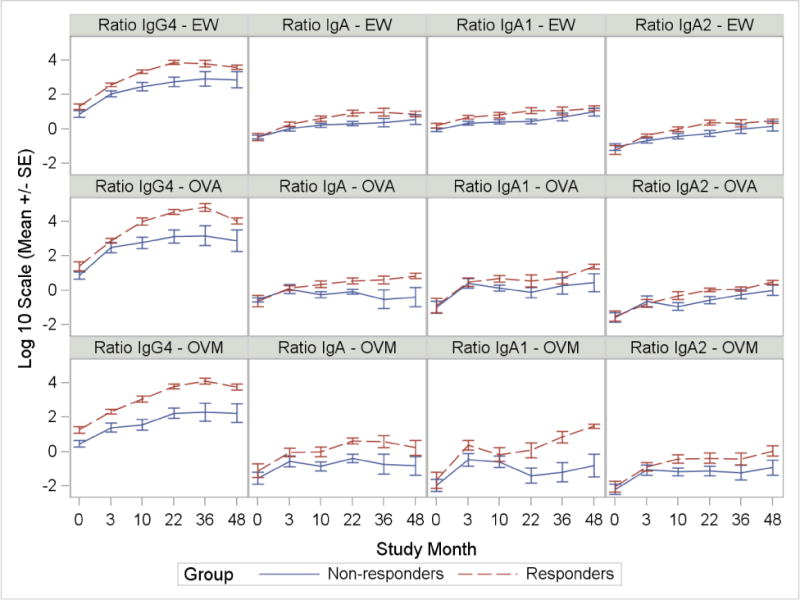
FIGURE 4.

Log ratios of IgA, IgA1, IgA2 and IgG4 to IgE for EW, OVA and OVM in responders versus non-responders. Graphs show logarithmic mean and SE for ratios with significant differences between responders and non-responders. Ratios of IgG4:IgE, IgA:IgE, IgA2:IgE to EW and IgA:IgE to OVA have significant time by responder group interactions.
