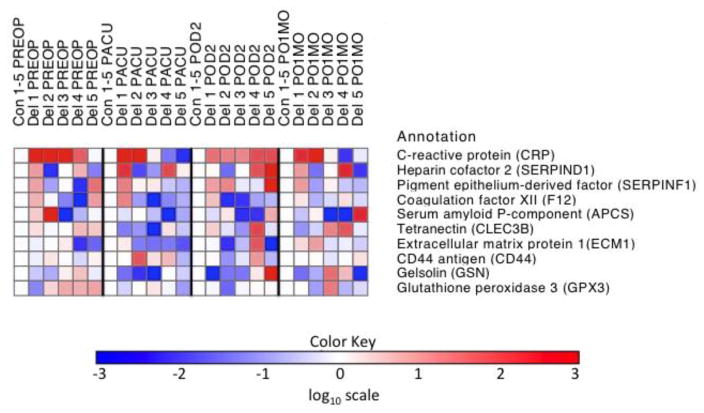
Figure 2. Heat map of iTRAQ relative quantitation for ten proteins in five matched case-control samples across four timepoints (PREOP, PACU, POD2 and PO1MO).
C-reactive protein and 9 other representative proteins commonly identified in the iTRAQ-mass spectrometry protein identification phase in the five matched case-control samples are presented. Red (and lighter shades) indicates that the protein increases in delirium cases versus matched no-delirium controls. Blue (and lighter shades) correspond to the protein decreasing in delirium samples. A white square means there was no significant detectable change in the protein levels in the case versus control. CRP is identified as a protein that increases in delirium samples at PREOP (4/5 matched pairs) and POD2 (5/5 matched pairs). The remaining nine proteins presented did not demonstrate consistent change at any timepoints. The log base 10 was used to generate the color key scale. CRP is the only protein in that demonstrates a specific and consistent directional change in relation to delirium. It is increased in its level in the delirious cases relative to matched controls, depicted by a red color. Several of the other proteins show differences between cases and controls, but they are a mixture of red and blue, so they go up or down in relation to their control condition and show no consistent pattern. PREOP= preoperative, PACU= postanesthesia care unit, POD2=postoperative day 2, PO1MO=1 month postoperation

