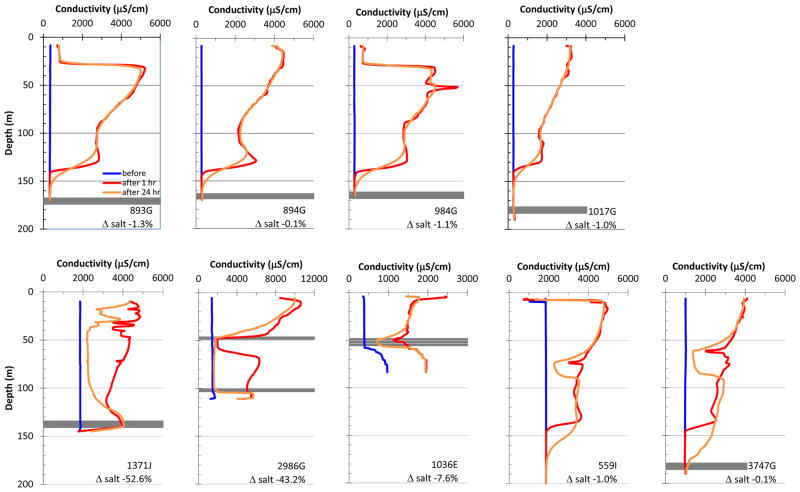
Figure 2.
Profiles of conductivity obtained before and after spiking of 9 wells >90 m deep with >50 μg/L As when tested in 2012–13. The horizontal grey bands indicate the depth range of the slotted PVC screens documented with the downhole camera. The bottom screen of well 1036E was not reached because it had been partially filled with sediment and the bottom screen of well 559I was blocked by a brick fragment (Fig. 3). Also listed are the changes in salt content over background in each well (%) between 1 hr and 24 hr after spiking.

