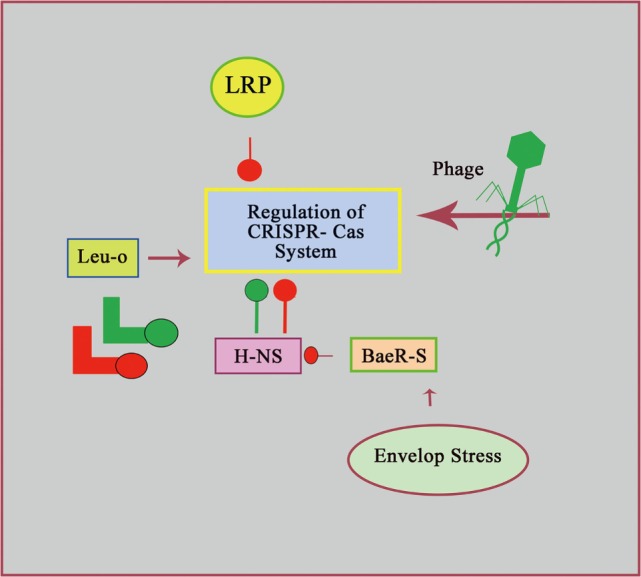
Figure 3.

Regulation of CRISPR–cas system. This network model indicates the summary of CRISPR–cas system regulation. Green (E. coli) and red (Salmonella) lines with round head indicate negative effects on CRISPR–cas system regulation. While, triangular arrow head indicates positive effect.
