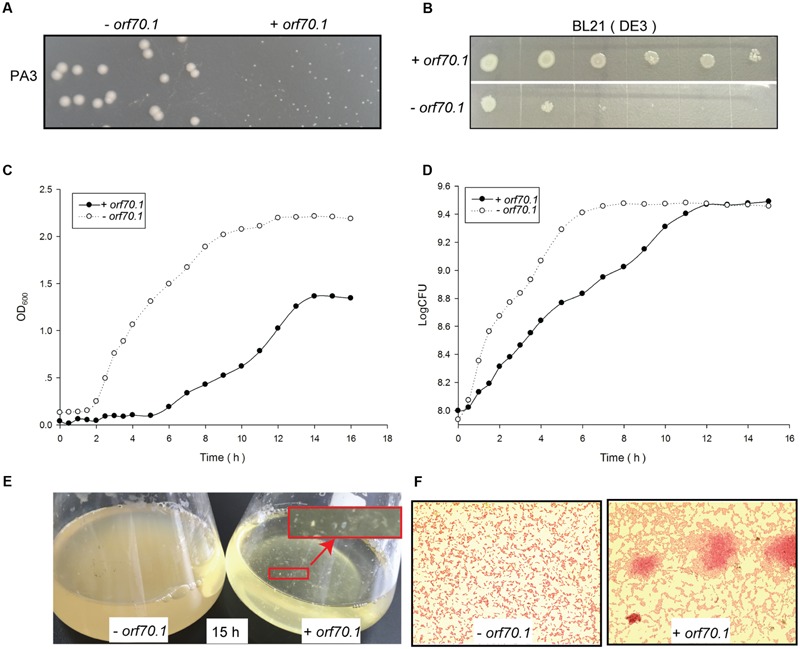
FIGURE 1.

Inhibition effects of gp70.1 on bacterial growth. (A) PA3 colonies on LB agar plate. (B) Inhibition of gp70.1 to E. coli BL21 (DE3). E. coli was 10-fold diluted serially and then inoculated on LB agar supplemented with 1mM IPTG. (C) Growth curve of PA3 based on absorbance value of OD600. (D) Growth curve of PA3 based on colony forming units. (E) Bacterial culture in LB broth cultured for 15 h. The red sign showed macroscopic cell aggregates of PA3/orf70.1, which were also observed in Gram stain. (F) Gram stain of bacteria cultured for 15 h. “- orf70.1” shows bacteria transformed with an empty plasmid, while “+ orf70.1” shows bacteria with plasmid carrying orf70.1.
