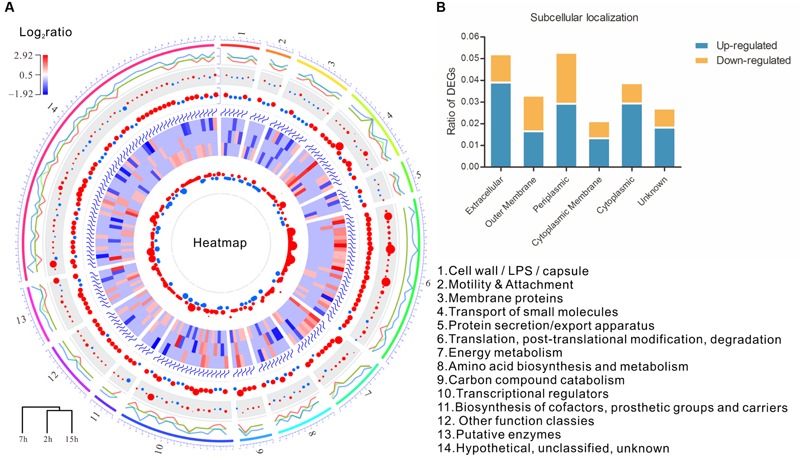
FIGURE 3.

Microarray analysis reveals influence of gp70.1 on gene expression of PA3. (A) Circular plots generated by OmicCircos showing the expression and function of DEGs. A total of 178 DEGs and 14 terms (1–14) of PseudoCAP function were involved. Circular tracks from outside to inside: track 1 shows the 14 PseudoCAP functions showed with different colors numbered with 1 to 14; track 2 is the three lines for quantile values for the detected fold changes (log2ratio) of gene expression ranged from -1.9 to 2.9. The middle line is for the median, the outside line and the inside line are for 90 and the 10%, respectively; Track 3 is the circle points with the center = median and radium = variance; Track 4 is the circle plot with the center equal to the mean and scaled value; Tracks 5 is the heatmap of 178 DEGs (red: up-regulated, blue: down-regulated); Track 6 is the circle plot with the center = median and radius = standard deviation; Track 7 is the 95% confidence interval of the fold changes. (B) Subcellular localization of DEGs. The percentages of up- or down-regulated genes in each subcellular localization were calculated and shown on y-axis.
