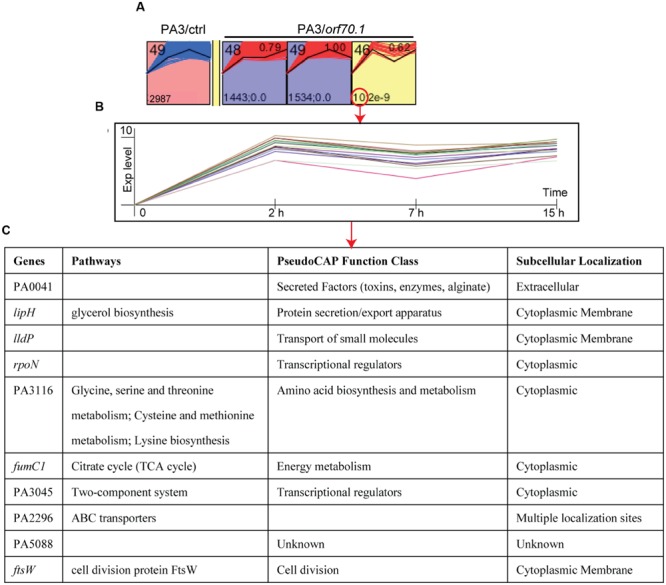
FIGURE 4.

STEM (Short Time-series Expression Miner) analysis of microarray data. A total of 49 model profiles are ordered by ID (top left). Each gene of PA3 was assigned to different model profiles based on the time series expression values (log ratios) from different experimental conditions (PA3/ctrl or PA3/orf70.1). (A) Profiles with significant difference between the original set profile (PA3/ctrl) and comparison set profile (PA3/orf70.1). The first expression values were transformed into 0. The expression pattern containing 2,987 PA3 genes was changed from profile 49 into profile 48 (1,443 genes, p = 0), 49 (1,534 genes, p = 0) and 46 (10 genes, p = 2e - 9) when overexpressed gp70.1 in PA3. Profile 46 shows the minimum correlation (r = 0.62, upper right). (B) Detailed model profile information of the most changed 10 genes in profile 46. (C) The information of pathway, function, and subcellular localization of the 10 genes.
