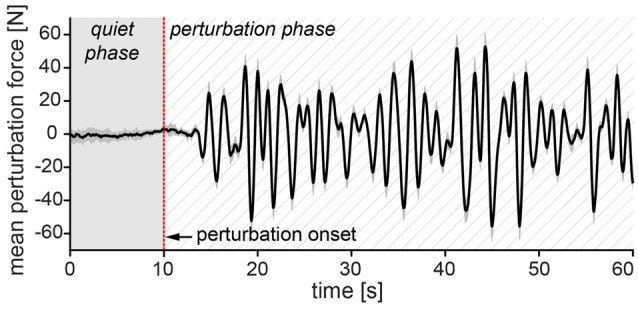
Figure 2.

Perturbation signal sample. Solid black curve represents first 60 s of mean perturbation signal from all 10 subjects with ±1 standard error of the mean (gray shade around the curve). In the first 10 s of each trial the perturbation value was at 0 N—quiet phase. After 10 s (perturbation onset), the perturbation gradually increased with alternated direction and amplitude—perturbation phase. Positive values of mean perturbation force represent forces in anterior direction and negative values represent forces in posterior direction. The perturbation signal was identical in both trials.
