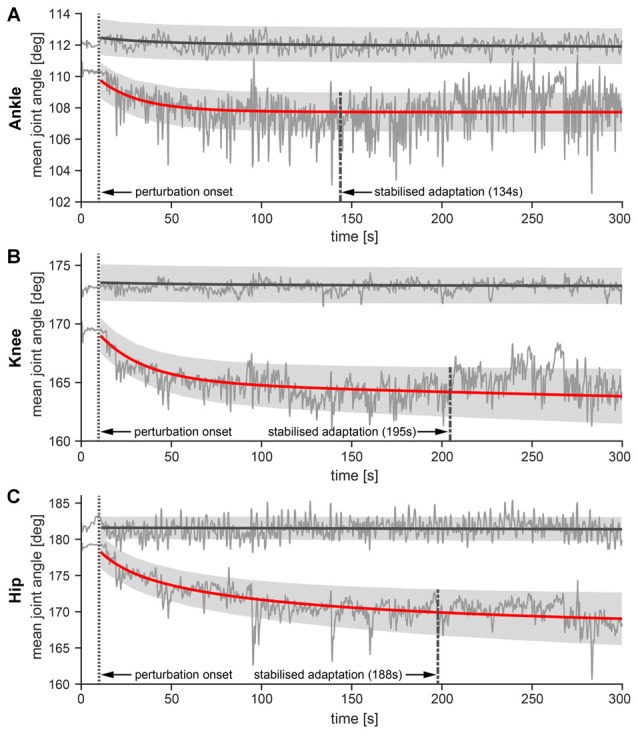
Figure 6.

Ankle (A) knee (B) and hip (C) angles over the time course of the perturbation. Thin solid lines represent mean joint angles from all 10 subjects during NH and WH trials. Thick solid lines represent exponential curve fit denoting adaptation of joint angles in the NH (red color) and WH trials (gray color), while shaded areas represent ±1 standard error of the mean of the exponential decay curve. Mean R2 value for the exponential decay curves for ankle joint in the NH trial was mean ± SE: 0.27 ± 0.06, for the knee joint mean ± SE: 0.31 ± 0.08 and for the hip joint mean ± SE: 0.61 ± 0.08. The dotted vertical lines represent perturbation onset while the dashed vertical lines indicate the mean time of stabilized changes in the joint angles after perturbation onset.
