Figure 1.
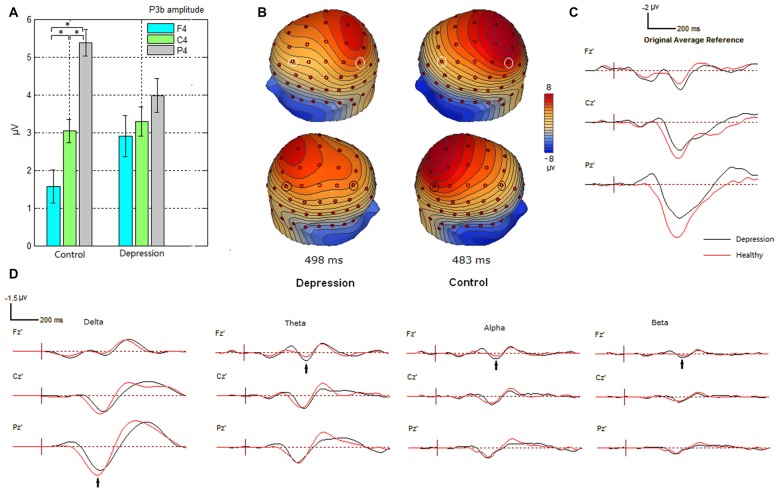
Alteration of P300 amplitudes at frontal, central and parietal sites in depression group. (A) Bar graph to show the effect of electrode site on P300 amplitude in the right hemisphere in participant groups. Amplitude was plotted as mean ± standard error. (B) Altered scalp voltage maps of the P300 in the right hemisphere in the depressive patients. Peak latencies of P300 are respectively indicated. The circled electrode sites are F3/4 and P3/4. (C) Grand average difference event-related potentials (ERPs) in healthy and depressive groups. (D) Grand average difference ERPs in different frequency bands in healthy and depressive groups. *indicates significant difference (P < 0.05).

