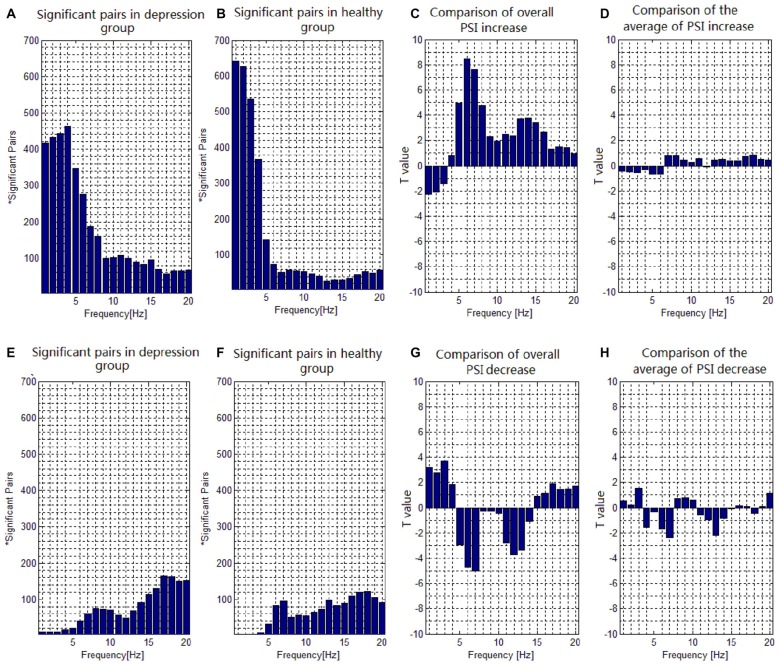
Figure 3.
Task-dependent increase and decrease of the electroencephalogram (EEG) phase synchronization indices across all subjects. (A) The number of electrode pairs exhibiting greater indices during the target condition than that during nontarget condition in depression group. (B) The number of electrode pairs exhibiting greater indices during the target condition than that during nontarget condition in healthy controls. (C) Comparison of the overall increase of PSI among all significant pairs in depressive patients with that in healthy subjects with a two-sample t-test. (D) Comparison of the average value of PSI increase among all significant pairs in depressive patients with that in healthy subjects with a two-sample t-test. (E) The number of electrode pairs exhibiting lower indices during the target task than that during nontarget condition in depression group. (F) The number of electrode pairs exhibiting lower indices during the target task than that during nontarget condition in healthy control. (G) Comparison of the overall decrease of PSI among all significant pairs in depressive patients with that in healthy subjects with a two-sample t-test. (H) Comparison of the average value of PSI decrease among all significant pairs in depressive patients with that in healthy subject with a two-sample t-test.

