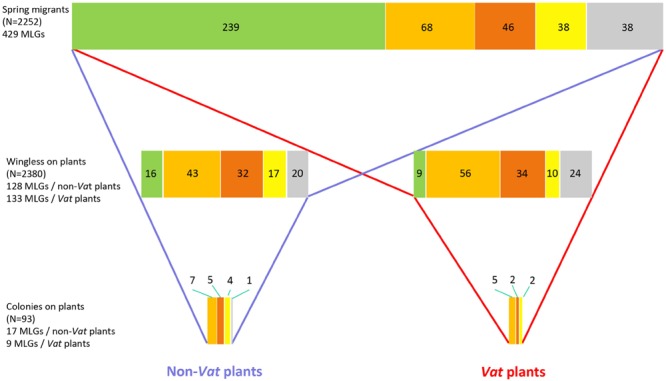
FIGURE 5.

Reduction of the clonal richness of A. gossypii populations during the infestation of melon crops in France. Clonal richness at each step of the infestation is represented by the length of the stripe. Colors within the stripe represent different genetic clusters of A. gossypii populations, with the size of each rectangle proportional to the number (indicated within) of MLGs assigned to the genetic cluster. The data are available from the Dryad Digital Repository: http://dx.doi.org/10.5061/dryad.gf54q
 Cucurbit I,
  Cucurbit II,
  Cucurbit III,
  other clusters,
  Not assigned at 75%.
