Figure 7.
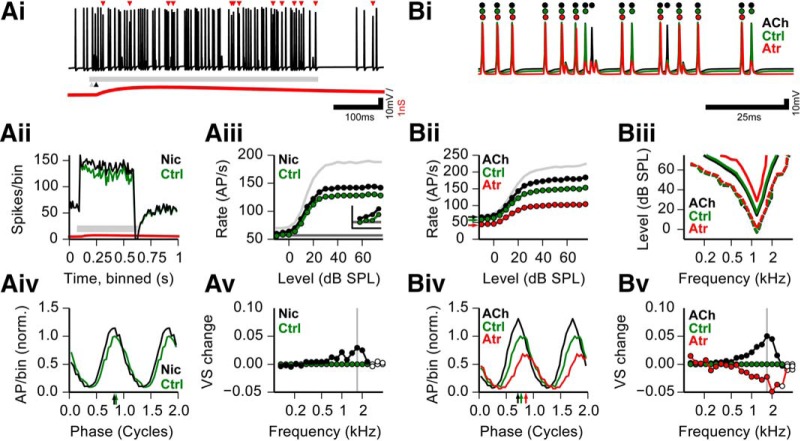
In silico model of the functional relevance of cholinergic SBC modulation. Ai, Example trace of simulated SBC membrane potential, including sound-driven excitation and inhibition, and matched nicotinic input. Calibration: 100 ms and 10 mV. Red triangles, Extra action potentials that failed in the simulation of the same spike train without the nicotinic input; red trace, shape of the nicotinic PSP (the y-scale represents 2 mV for this trace); gray bar, sound stimulus; black arrowhead, onset of nicotinic event. Aii, Peristimulus time histogram for 100 repetitions of Ai with (black line) and without (green line) nicotinic input. Gray bar depicts stimulus duration, and red line depicts nicotinic PSP, as in A. Simulation conditions were 3 kHz, 20 dB SPL; CF = 3 kHz. Aiii, Rate-level function (RLF) for −10 to 75 dB SPL, 3 kHz. CF = 3 kHz. Dark gray line shows identical spontaneous rates for all conditions. Colors are as in Aii. Light gray curve shows the input RLF. Inset shows the first four levels (−10, −5, 0, and 5 dB SPL; scale of inset: x-axis, −16 to 6 dB SPL; y-axis, 50–70 spikes/s). Aiv, Period histograms of spike times for the nicotinic condition; colors are as in Aii, normalized to the maximal amplitude of the control condition. Arrows show preferred phase. Simulation conditions shown here were 1682 Hz, 60 dB SPL, CF = 1200 Hz (see gray vertical line in Av). Av, Relative change in vector strength to 60 dB SPL tones of different frequencies for nicotinic condition compared with the control condition. Colors are as in Aii. Filled circles depict significant phase locking. Gray vertical line shows the frequency of the period histogram in Aiv. Bi, Example trace of the same spike train simulated at the three modulatory conditions. Red, simulated atropine; black, simulated carbachol; green, control. Circles mark the occurrence of action potentials under the three conditions. Calibration: 25 ms and 10 mV. Bii, Rate-level functions for the three modulatory conditions in Bi; colors are as in Bi. Light gray curve shows input RLF. Simulation conditions were 1.2 kHz, CF = 1.2 kHz. Arrows show the spontaneous rate per condition. Biii, Frequency response area for 9 stimulus levels and 21 frequencies; colors are as in B. Dashed contour for each color shows +5 Hz increase in response spike rate vs spontaneous rate; inner, solid contour shows +50 Hz increase in response spike rate vs spontaneous rate. CF = 1.2 kHz. Biv, Period histograms of spike times for the three modulatory conditions; colors are as in Bi, normalized to the maximal amplitude of the control condition. Arrows show the preferred phase. Simulation conditions were 1682 Hz, 60 dB SPL, CF = 1200 Hz. Bv, Relative change in vector strength to 60 dB SPL tones of different frequencies for three modulatory conditions, compared with the control condition. Colors are as in B. Filled circles depict significant phase locking. Gray vertical line shows the frequency of the period histogram in Biv. Ctrl, Control; Nic, nicotinic input.

