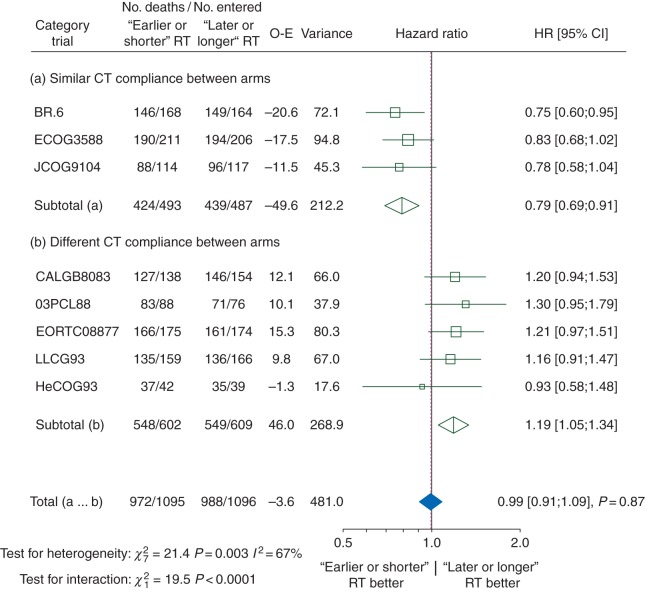
Figure 1.
Effect of ‘earlier or shorter’ radiotherapy versus ‘later or longer’ radiotherapy on overall survival according to CT compliance. Each trial is represented by a square, the centre of which denotes the HR of death for that trial comparison, with the horizontal lines showing the 95% CIs. The size of the square is directly proportional to the amount of information contributed by the trial. The clear diamonds represent pooled HRs for the trial groups and the black diamond the overall HR, with the centre denoting the HR and the extremities the 95% CI. The fixed-effect model was used. Trials were chronologically ordered within each category of trials. Of note, data on CT compliance were not available for the CCCWFU62286 trial, which is thus not included in this analysis. CI, confidence interval; CT, chemotherapy; HR, hazard ratio; O-E, observed-expected; RT, radiotherapy.

