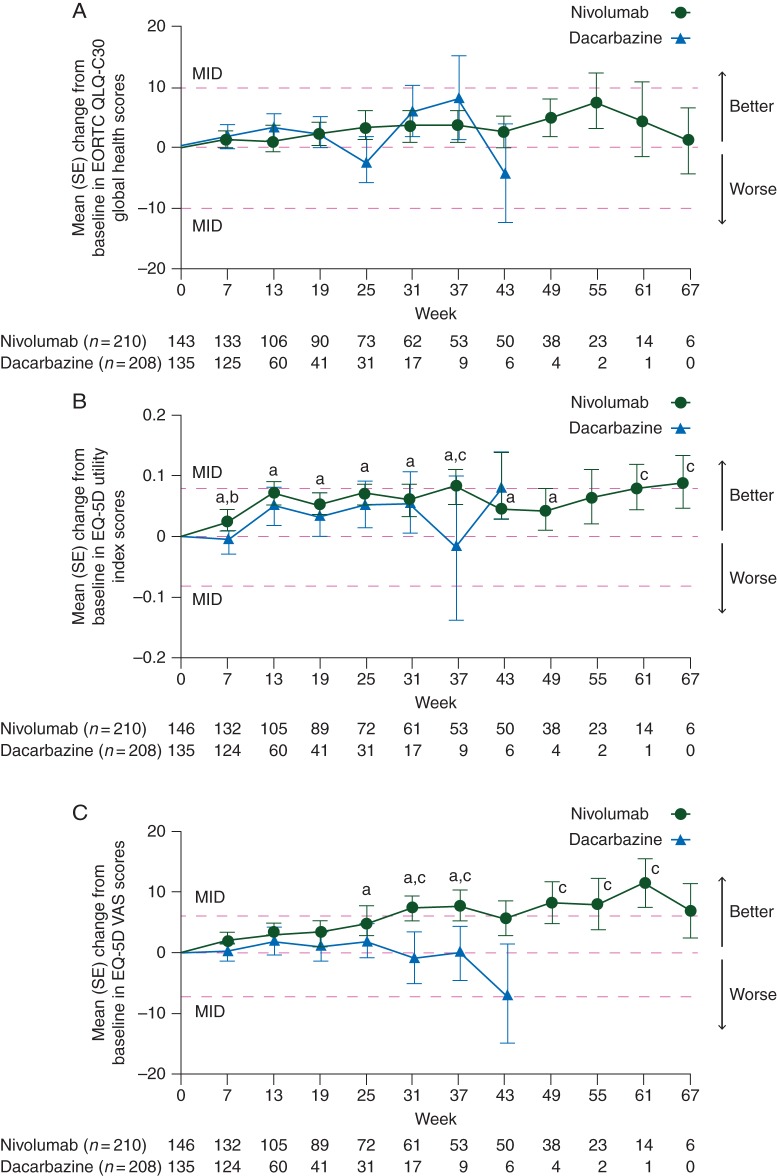
Figure 1.
(A) Mean (SE) change from baseline in EORTC QLQ-C30 Global Health scores. Only time points where data are available for ≥5 patients in either treatment arm are plotted on the graph. MID consists of a change of ≥10. The mean baseline (SE) scores were 68.9 (20.2) for nivolumab and 66.2 (25.1) for dacarbazine. (B) Mean (SE) change from baseline in EQ-5D utility index scores. Only time points where data are available for ≥5 patients in either treatment arm are plotted on the graph. MID consists of a change of ≥0.08. The mean baseline (SE) scores were 0.778 (0.215) for nivolumab and 0.771 (0.310) for dacarbazine. (C) Mean (SE) change from baseline in EQ-5D VAS scores. Only time points where data are available for ≥5 patients in either treatment arm are plotted on the graph. MID consists of a change of ≥7. The mean baseline (SE) scores were 70.9 (19.9) for nivolumab and 69.1 (21.8) for dacarbazine. EORTC QLQ-C30, European Organisation for Research and Treatment of Care Core Quality of Life Questionnaire; EQ-5D, EuroQoL Five Dimensions Questionnaire; MID, minimally important difference; SE, standard error; VAS, visual analog scale. aP ≤ 0.05 versus baseline in the nivolumab arm. bP ≤ 0.05 for nivolumab versus dacarbazine arms. cExceeded MID.

