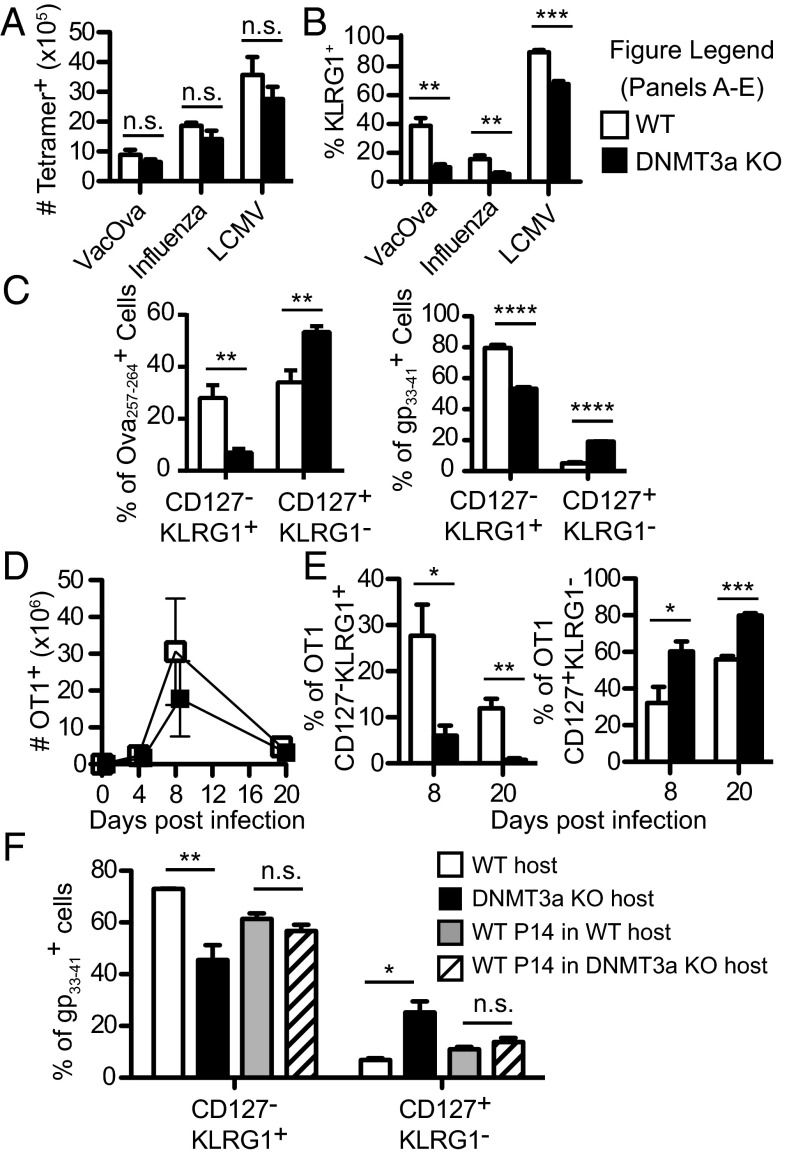
Fig. 1.
DNMT3a is required for normal CD127+KLRG1− memory precursor cell versus CD127−KLRG1+ terminal effector cell differentiation. (A) Absolute number of tetramer+CD8+ splenocytes in DNMT3a KO mice and WT littermates after VacOva (day 7), influenza (day 10), or LCMV (day 10) infections. Bar graph (mean ± SEM) compares WT (n = 4) and DNMT3a KO (n = 4) mice. (B) Splenocytes from A were stained for KLRG1. Bar graphs (mean ± SEM) depict the percent of tetramer+CD8+ that are KLRG1+. (C) Bar graphs (mean ± SEM) depict populations defined by CD127 and KLRG1 surface staining gated on CD8+ Ova257–264-tetramer+ cells 7 d after VacOva infection (Left) or gp33–41-tetramer+CD8+ T cells day 10 post-LCMV infection (Right) from WT (n = 4) and DNMT3a KO (n = 4) mice. (D) Absolute numbers of splenic OT1 DNMT3a WT or KO T cells recovered postinfection. Data points depict mean ± SD. WT (n = 4) and DNMT3a KO (n = 4) OT1 for each time point. (E) Percent of CD127−KLRG1+ terminal effector cells (Left) and the percent of CD127+KLRG1− memory precursor cells (Right) gated on WT or DNMT3a KO OT1 T cells after adoptive transfer and VacOva infection. Bar graphs (mean ± SEM) compare WT (n = 4) and DNMT3a KO (n = 4) mice for each time point. (F) Adoptive transfer of WT P14 CD8+ T cells into WT or DNMT3a KO congenic hosts followed by LCMV infection. Host gp33–41-specific CD8+ T cells and P14 transferred cells were phenotyped 10 d after infection. Bar graphs (mean ± SEM) compare WT gp33–41-specific host, DNMT3a KO gp33–41-specific host, WT P14 CD8+ T cells in WT host, and WT P14 CD8+ T cells in DNMT3a KO host (n = 3 mice per group). All experiments in A–F were performed at least three times with similar results. For all panels, n.s. P > 0.05, *P < 0.05, **P < 0.01, ***P < 0.0005, ****P < 0.0001 (unpaired two-tailed Student’s t test).

