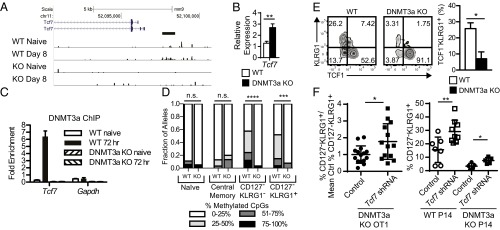
Fig. 4.
DNMT3a establishes a CpG DNA methylation signature of terminal effector cells during the early effector cell stage in the Tcf7 promoter. (A) Tracks depicting MBD-seq reads from indicated samples are plotted at the Tcf7 promoter in the University of California Santa Cruz genome browser. A region of differential methylation is indicated below the Tcf7 promoter as a horizontal bar. (B) Relative qPCR expression of Tcf7 transcripts from sorted Ova257–264-specific CD8+ T cells post VacOva infection. Bar graphs (mean ± SEM) show the relative expression (normalized to 18s RNA expression) from individual mice (n = 4 per group). This experiment was performed three times with similar results. (C) ChIP of DNMT3a from WT or DNMT3a KO CD8+ T cells that were freshly isolated naïve cells or activated 72 h in vitro. Bar graphs (mean ± SD) compare WT and DNMT3a KO, naïve and 72-h stimulated samples (n = 3 replicates per qPCR) and depict fold-enrichment compared with control IP for indicated gene targets. The experiment was performed three times with similar results. (D) Tcf7 promoter methylation determined by bisulfite sequencing in sorted polyclonal naïve and central memory CD8+ T cells and day 6 post-VacOva CD127−KLRG1− and CD127−KLRG1+ CD8+ WT or DNMT3a KO OT1 T cells. Bar graphs depict fraction of alleles with indicated frequency of methylated CpG sites of the 18 possible per clone. Number of unique alleles sequenced per sample was between 15 and 33. Distributions were compared by Mann–Whitney test. ***P < 0.0005, ****P < 0.0001. The experiment was performed two times with similar results. (E) Representative plots of KLRG1 surface and Tcf1 intracellular staining of adoptively transferred WT or DNMT3a KO OT1 CD8+ T cells 10 d post-VacOva infection. Numbers indicate percentage in each quadrant. (Right) Bar graphs (mean ± SEM) compare WT (n = 4) and DNMT3a KO (n = 4). The experiment was performed three times with similar results. (F) Normalized frequency of CD127−KLRG1+ DNMT3a KO OT1 T cells (%CD127−KLRG1+/mean of control % CD127−KLRG1+ from an individual experiment) transduced with the indicated lentivirus constructs 7 d after adoptive transfer into recipients infected with VacOva. Normalized frequencies from individual mice, mean, and SD are shown; control (n = 15) and Tcf7 shRNA (n = 13) are pooled from three independent experiments (Left). Frequency of CD127−KLRG1+ WT or DNMT3a KO P14 T cells transduced with the indicated lentivirus constructs 7 d after adoptive transfer into recipients infected with LCMV (Right). *P < 0.05, **P < 0.01 (unpaired two-tailed Student’s t test).

