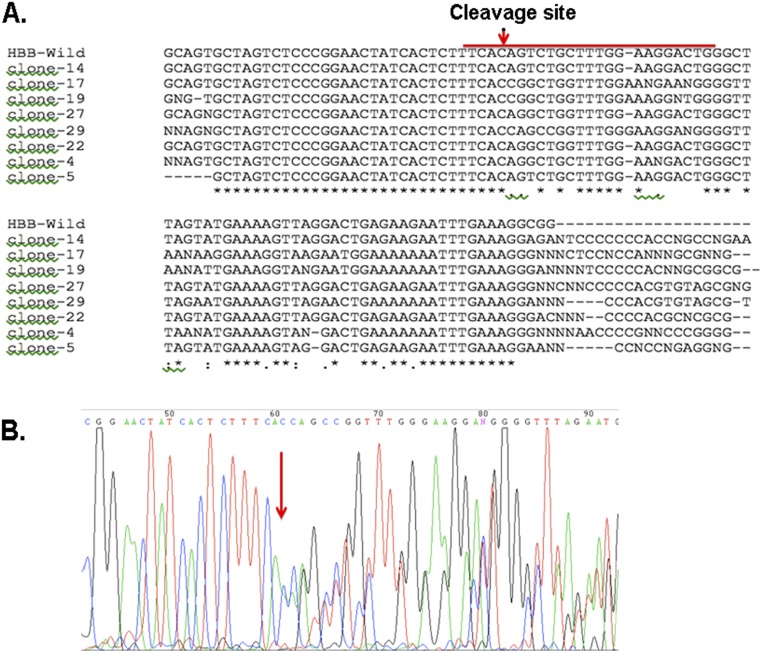
Fig. S3.
Detection of NHEJ by Sanger sequencing in the clones which shown same size of PCR product. (A) Sequence alignment of representative clones with WT PCR products. PCR products with same-size fragments amplified from the 3′ breakpoint of eight clones showed mixed signal when aligned with WT sequences. The red line indicates the targeting site. The asterisks indicate matched nucleotides. (B) Histogram of Sanger sequencing further confirmed that the mixed signal started from the cleavage site indicated by the red arrow.

