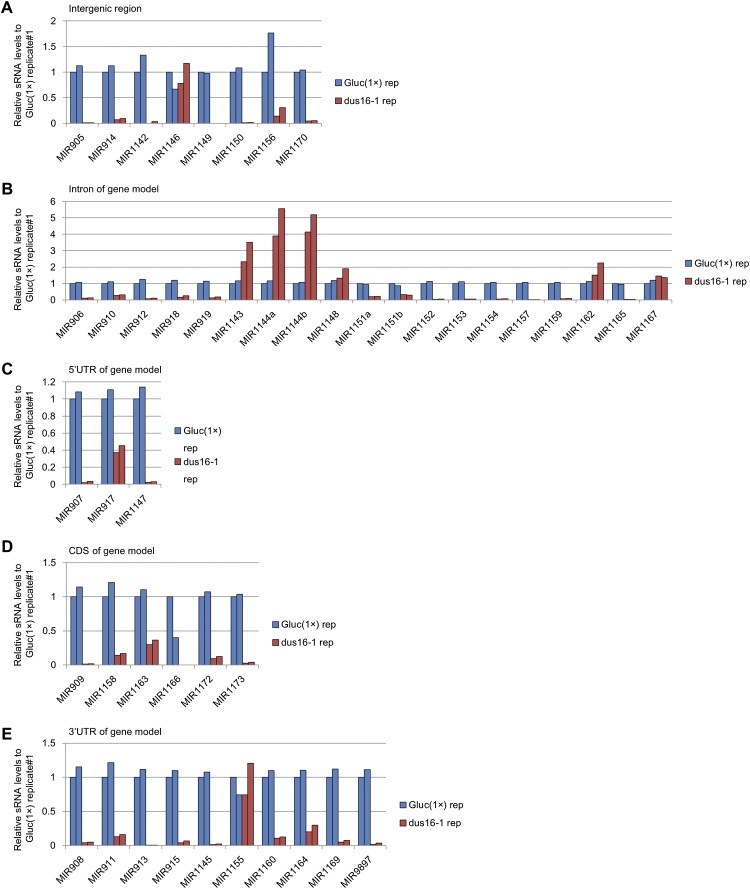
Fig. S2.
sRNA-seq analysis of Gluc(1×) and dus16-1. Biological duplicates of sRNA libraries were generated, and sRNA reads ranging from 17–25 nt were aligned to stem–loop sequences registered in miRBase. All sRNA reads that mapped to individual stem–loop sequences in each pre-miRNA were counted. The absolute read counts were normalized to that of Gluc(1×) replicate #1. Analyzed miRNA genes were grouped into five categories based on the location of stem–loops in the gene models. (A) Intergenic region. (B) Intron of the gene model. (C) The 5′ UTR of the gene model. (D) Coding sequence of the gene model. (E) The 3′ UTR of the gene model.

