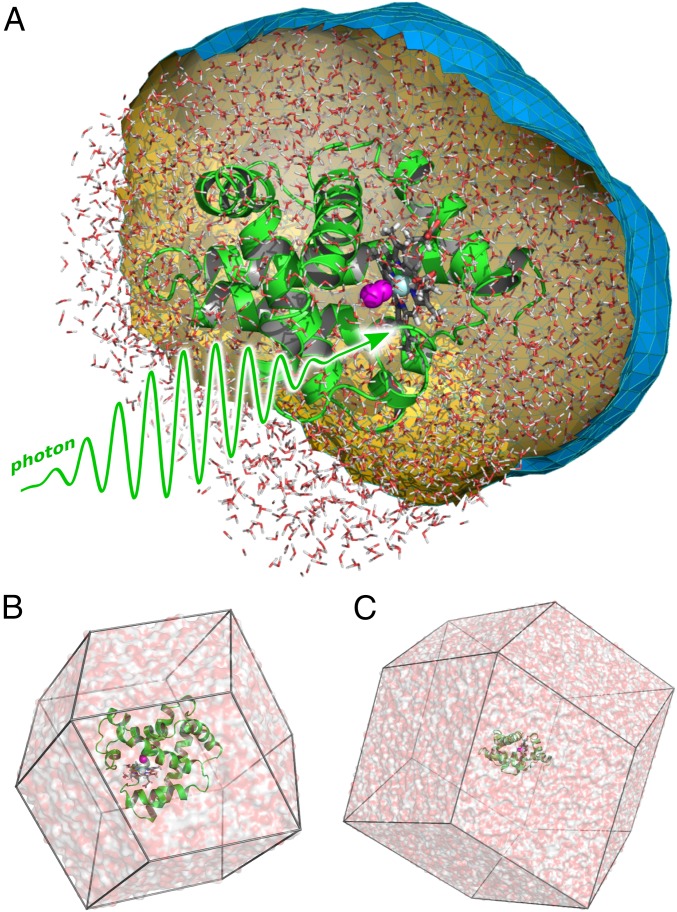
Fig. 1.
(A) Molecular representation of myoglobin (Mb). The backbone trace is shown as green cartoon, the heme as gray sticks, CO as magenta spheres, and iron as light blue sphere. A spatial envelope, here at a distance of 6 Å from all protein atoms, is shown as blue/orange surface. Water atoms (white/red sticks) inside the envelope contribute to the SWAXS calculations. (B) Typical small and (C) large simulation system of Mb, used to compute WAXS and SAXS patterns, respectively.

