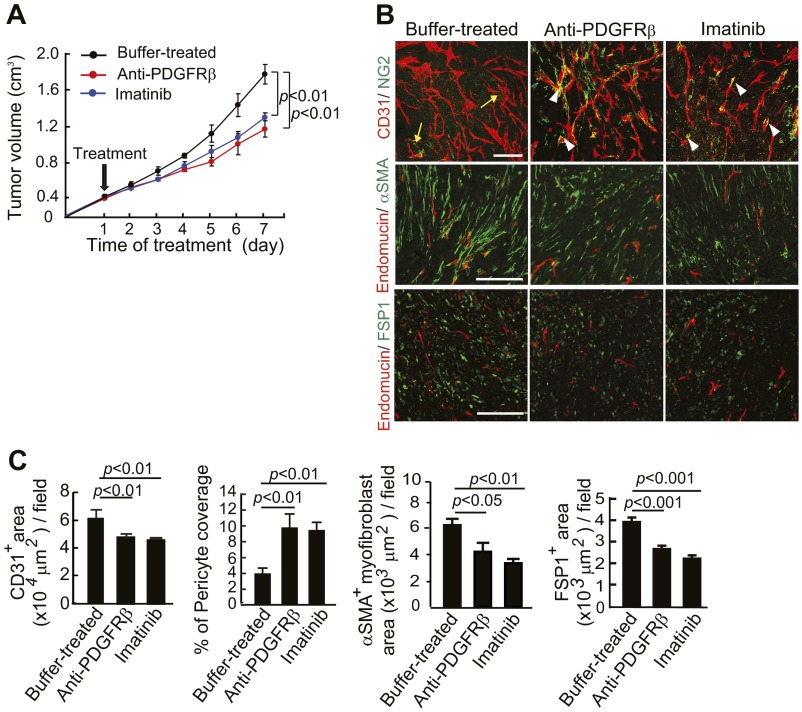
Fig. S4.
Tumor growth rates and changes of pericytes and stromal fibroblasts in established tumors that received various treatments. (A) Tumor growth curves in buffer-, anti-PDGFRβ-, and imatinib-treated T241-PDGF-BB tumor-bearing mice (n = 4–6 animals per group). (B) CD31+ (red) vessels and NG2+ pericyte (green) signals, endomucin+ tumor vessels (red) and αSMA+ cells (green), and endomucin+ tumor vessels (red) and FSP1+ stromal fibroblasts (green) in imatinib-, anti-PDGFRβ, and buffer-treated T241-PDGF-BB tumors. Arrows indicate the vessel-disassociated pericytes and arrowheads point to vessel-associated pericyes. (Scale bars: Top, 50 μm; Middle and Bottom, 100 μm.) (C) Quantification of CD31+ microvessel density (n = 7 fields per group), pericyte area (n = 7 fields per group), and coverage (n = 7 fields per group), αSMA+ myofibroblsts (n = 12 fields per group), and FSP1+ fibroblasts (n = 12 fields per group) in imatinib-, anti-PDGFRβ-, and buffer-treated T241-PDGF-BB tumors. Data are represented as mean ± SEM.

