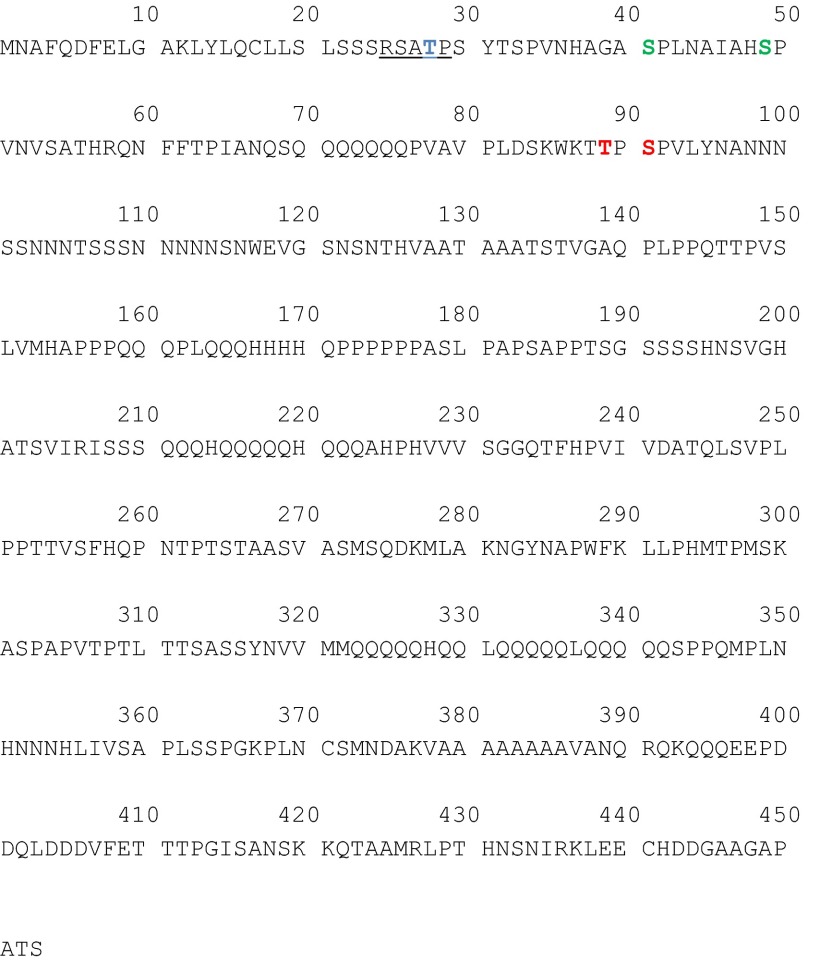
Fig. S3.
Locations of Cic phosphorylation sites identified by mass spectrometry. A Cic1 region is shown (amino acids 1–453). The putative DYRK1A consensus is underlined, and the corresponding residue (T28) is highlighted in blue. T28 phosphorylation was not detected by mass spectrometry. S41 and S49 (green) were more highly phosphorylated in wild-type Mnb samples compared with MnbKR. T89 and S91 phosphorylations (red) were found exclusively in the wild-type Mnb samples.

