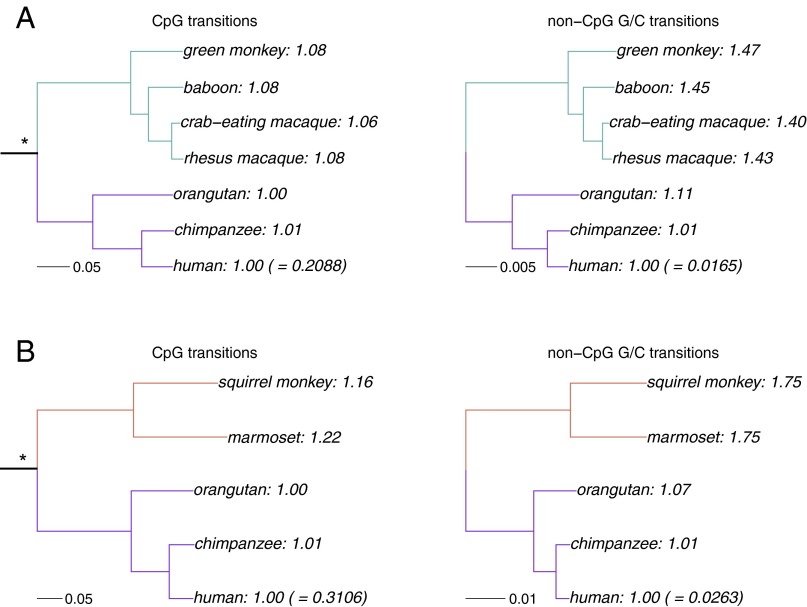
Fig. 2.
Comparison of substitution rates in hominoids and monkeys. For transitions from CpG and non-CpG G/C sites, the total branch length is shown from either (A) the hominoid–OWM ancestor to each leaf, or (B) the hominoid–NWM ancestor to each leaf. The branch length from the root to the human tip was set to 1 (with the actual value in parenthesis), and other lineages normalized to the human branch length. Branches from root-hominoids are shown in purple, from root-OWM in green and from root-NWM in orange. *Hominoid–monkey (either OWM or NWM) ancestor used as root. R code to replicate this figure is available at: https://github.com/priyamoorjani/Molecular-clock_figures-and-data/blob/master/Figure2.R.

