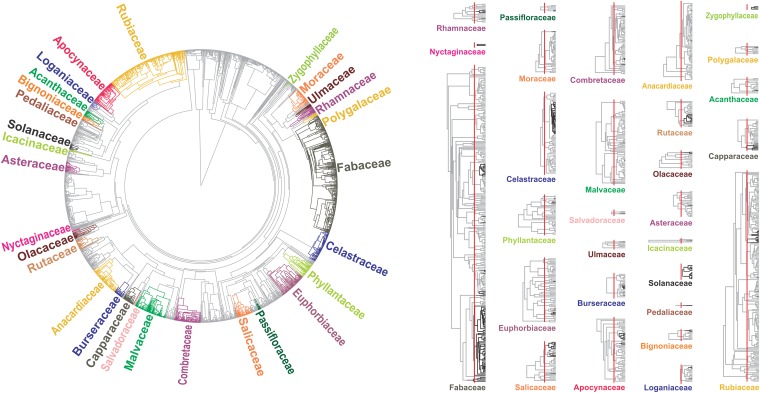
Fig. 3.
(Left) Phylogeny of southern African woody flora and position of spiny species. Flora were reconstructed based on DNA barcodes using a maximum likelihood approach after transforming branch lengths to millions of years ago by enforcing a relaxed molecular clock and multiple calibrations. Colored branches highlight families containing at least one spiny species. The subtrees for these families are presented (Right), with the position of spiny species indicated in black (shades of gray indicate the probability of the ancestral lineages being spiny). The red bar indicates 17 Ma on all subtrees.

