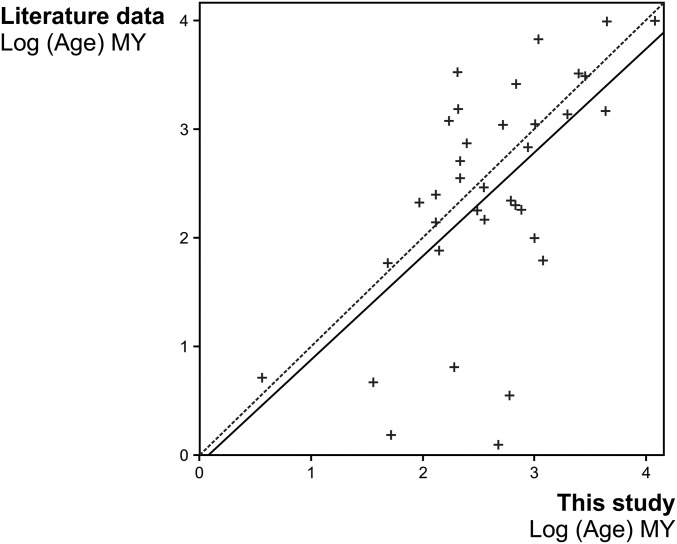
Fig. S2.
Comparison of ages estimated in this study and previously published studies. Table S5 shows data sources. The dotted line represents no difference between estimations of ages in this study and the literature (slope = 1; intercept = 0); the solid line is the regression line of the linear model (slope = 0.95; intercept = −0.08). The intercept is not significantly different from zero (P value = 0.89). The ages estimated in our analyses do not differ significantly (paired t test; mean of the differences = −0.34 My; P value = 0.84) from ages estimated in the literature.

