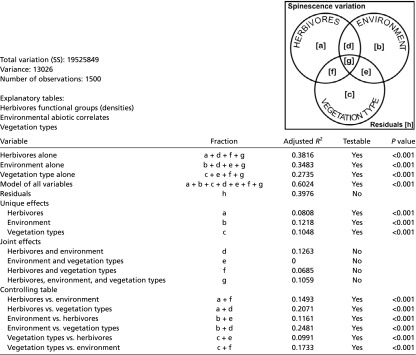
Table S1.
Details of the variation partitioning: Partition table
 |
Total variation (sum of squares): 19,525,849. Variance: 13,026. Number of observations: 1,500. Explanatory tables: herbivores functional groups (densities), environmental abiotic correlates, and vegetation types.
