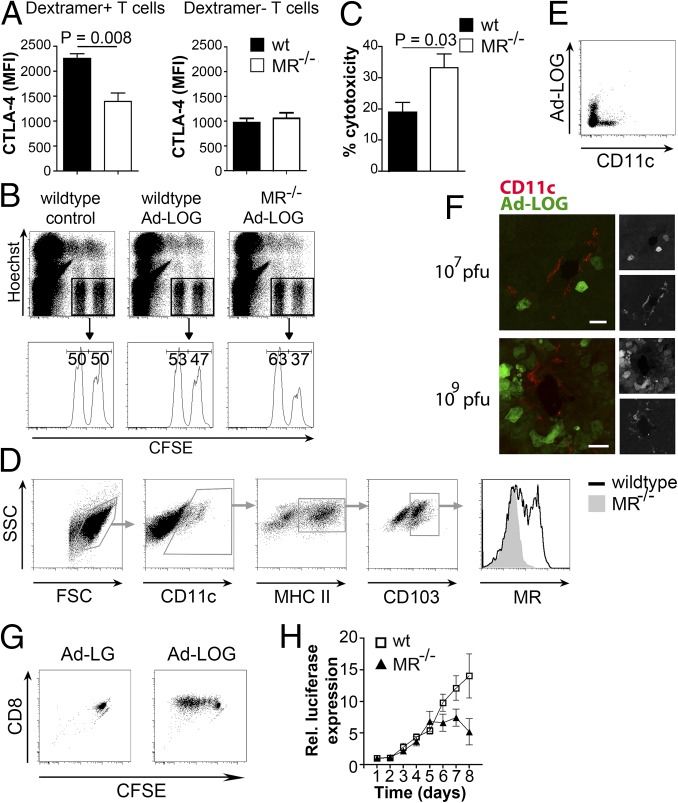
Fig. 6.
Presence of the MR on DCs impairs cytotoxicity of activated T cells in vivo. (A) The wt or MR−/− BM-DCs were transduced with Ad-LOGs and injected into wild-type mice. After 6 d, CTLA-4 expression was monitored on SIINFEKL/Kb dextramer+ CD8+ and SIINFEKL/Kb dextramer− splenic CD8+ T cells. The graphs depict statistical analysis (mean ± SEM) of four biological replicates. (B) Wild-type or MR−/− BM-DCs were transduced with Ad-LOGs and injected into wild-type mice. After 5 d, mice were challenged with target (CFSEhigh) and nontarget (CFSElow) cells. After 4 h, their ratio was determined by flow cytometry. Untransduced DCs were used as controls. (C) Combined statistical analysis (mean ± SEM) of B from two independent experiments with n = 7. (D) MR expression in DCs from the liver of wild-type or MR−/− mice. (E) GFP expression in DCs from the liver of wild-type mice infected with 107 pfu of Ad-LOGs. (F) GFP expression in the liver from wild-type mice infected with 107 or 109 pfu of Ad-LOGs. (Scale bars: 30 μm.) (G) Proliferation of CFSE-labeled OT-I cells after incubation with sorted CD11c+ cells from the liver of mice infected with Ad-LOGs or control virus (Ad-LG). (H) The wt or MR−/− mice were injected i.v. with 107 pfu of Ad-LOGs. Total luciferase activity was determined after i.p. injection of 50 mM luciferin. The graph shows combined statistical analysis (mean ± SEM) from two independent experiments with n = 11. Rel., relative.

