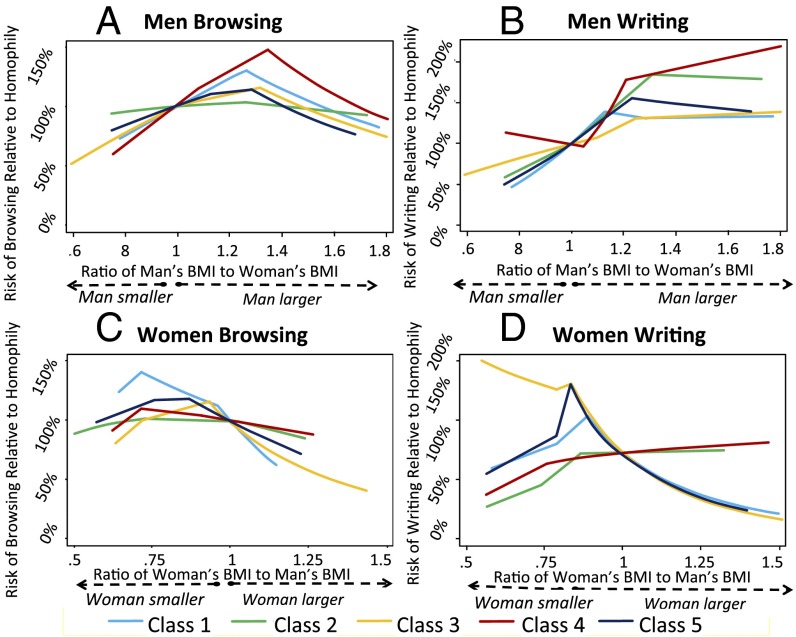
Fig. 4.
The probability of browsing and writing someone of a given value of body mass relative to the probability of browsing or writing someone of equal body mass. A and B show results for men, and C and D show results for women (n = 1,855 users; estimates based on 1,147,499 browsing and writing observations). The x axis displays the ratio of the user’s attribute value to that for potential matches. The y axis shows the associated probability ratio. Outliers are trimmed (top and bottom 1%); all variables except for the focal attribute are held at their mean values.

