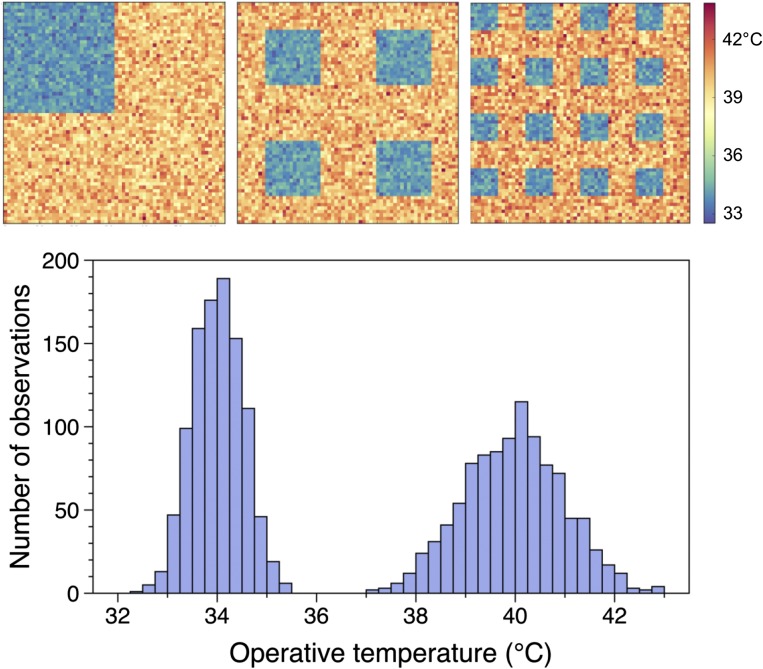
Fig. S1.
Bimodal distributions of operative temperatures were distributed in three different ways to create thermal landscapes ranging from clumped to dispersed. From left to right, these three maps exemplify the structure of the three types of landscapes for a common distribution (plot beneath maps).

