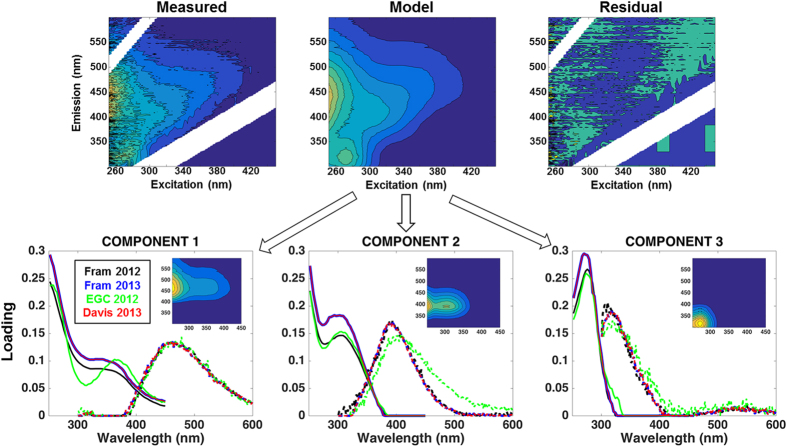
Figure 5. PARAFAC model and isolated components.
(top) Three-dimensional fluorescence landscapes example of the measured, modeled and residual EEMs of the PARAFAC analysis. (bottom) The excitation (solid line) and emission (dashed line) spectra for the three fluorescent components identified by PARAFAC model for each of the cruises. Inset plots show the three-dimensional fluorescence landscapes for each of the final PARAFAC-derived component used in this work (with all cruises merged into one dataset).

