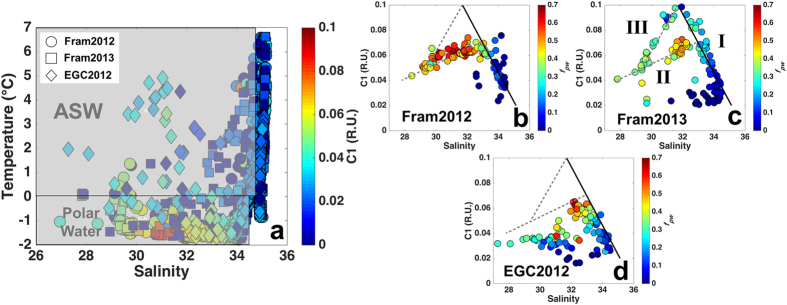
Figure 6. T-S diagram and correlations between salinity and C1 in the east of Greenland.
(a) Temperature (°C) vs. salinity with colorbar indicating C1 (R.U.) for all the samples collected in the eastern Greenland cruises. (b–d) Salinity vs. C1 (R.U.) and fpw as colorbar for polar waters and ASW for each of the eastern Greenland cruises. Black solid line (I) indicates the mixing curve for the polar waters (based on Fram 2012 and 2013 datasets). Gray dashed lines (II and III) indicate the two distinct mixing curves of polar waters over the Greenland shelf. The regressions were obtained by combining the three datasets. (I) y = –0.02 *(Sal) + 0.723, r2 = 0.90, p < 0.0001, n = 240. (II) y = 0.0042 *(Sal) − 0.0698, r2 = 0.90, p < 0.0001, n = 126. (III) y = 0.0183 *(Sal) −0.4816, r2 = 0.98, p < 0.0001, n = 18.

