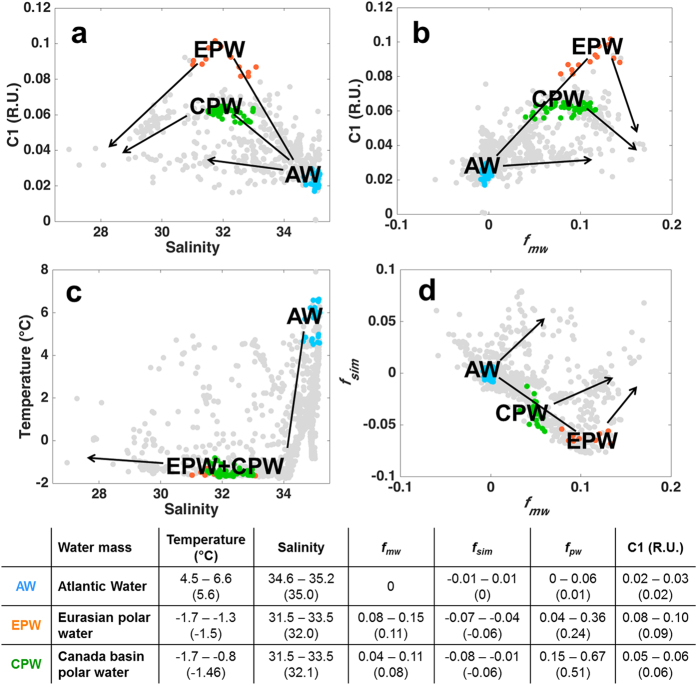
Figure 8. Schematic graphs for eastern Greenland.
Schematic graphs showing the behavior during mixing of distinct waters defined in the text (Atlantic water, Eurasian and Canada basin polar waters, whose end members in this study are colored accordingly): for (a) C1 and salinity, (b) C1 and fmw, (c) temperature and salinity, (d) fsim and fmw. All data used in this study is shown with gray dots. Lines indicate the mixing between different waters, whose end-members for this study are tabulated below. Arrows represent the approximate direction of the deviation expected by dilution with sea-ice melt and precipitation (including glacial melt). The table shows information (range and average) on some parameters for the end members of each water type identified in this study.

