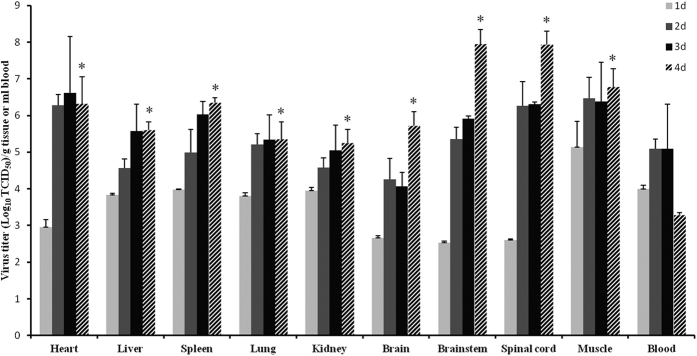
Figure 3. Virus dissemination and replication in different tissues of CA16-infected gerbils.
21-day-old gerbils were inoculated with CA16-194 at 100 × LD50. The graph shows the virus loads in the heart, liver, spleen, lung, kidney, brain, brainstem, spinal cord, muscle and blood from CA16-infected gerbils at 1, 2, 3 and 4 days post infection. Virus loads were assessed by real-time RT-PCR and compared with standard curves obtained from 10-fold serial dilutions of CA16-194. Results represent the mean ± standard error of the virus titer (log10 TCID50) per gram of tissue or per milliliter of blood from two independent experiments using three technical replicates each. *Significantly different from the day 1 group in each tissue (p < 0.01).

