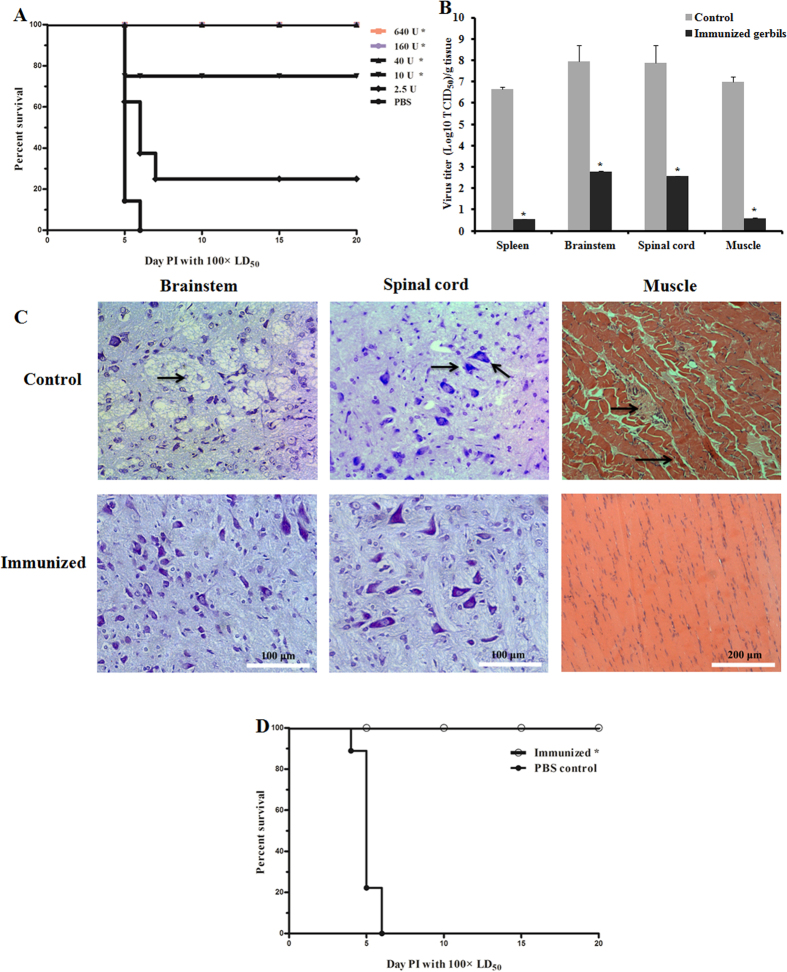
Figure 5. Protective efficacy against lethal CA16 challenges in immunized gerbils.
Gerbils were immunized with a CA16 vaccine at the age of 7 and 14 days and challenged at the age of 21 days with CA16 virus using a 100 × LD50. (A) Survival curves of groups of gerbils (n = 8) were immunized with the CA16 vaccine using a dose of 2.5, 10, 40, 160, 640 U or PBS as a negative control, then challenged with strain CA16-194. Curves were compared with the PBS control group using the log-rank test. Representative results from two similar experiments are shown. *Significantly different from the control group (p < 0.01). (B) Viral loads in the spleen, brainstem, spinal cord and muscle tissue of gerbils four days post infection. Gerbils were immunized with the CA16 vaccine using a dose of 160 U or a PBS control, then challenged with strain CA16-194. Virus loads were assessed by real-time RT-PCR and compared with standard curves obtained from 10-fold serial dilutions of CA16-194. Results represent the mean ± standard error (n = 3 each) of the virus titer (log10 TCID50) per gram of tissue. *Significantly different from the control group (p < 0.01). (C) Histology examinations of brainstem, spinal cord (Nissl stained) and muscle tissues (haematoxylin and eosin stained) harvested from CA16 vaccine-immunized and control gerbils 4 dpi. Gerbils were immunized with the CA16 vaccine using a dose of 160 U or a PBS control, then challenged with strain CA16-194. The arrows indicated shrinking neurons and sieve-like changes in brainstem, neuronophagia in the spinal cord, degeneration of skeletal muscle fibers and inflammatory cell infiltration in muscle of PBS controls. (D) Survival curves of groups of gerbils (n = 8) were immunized with the CA16 vaccine using a dose of 160 U or PBS as a negative control, and then challenged with CA16-196 using a 100 × LD50. Curves were compared with the PBS control group using the log-rank test. *Significantly different from the control group (p < 0.01).

