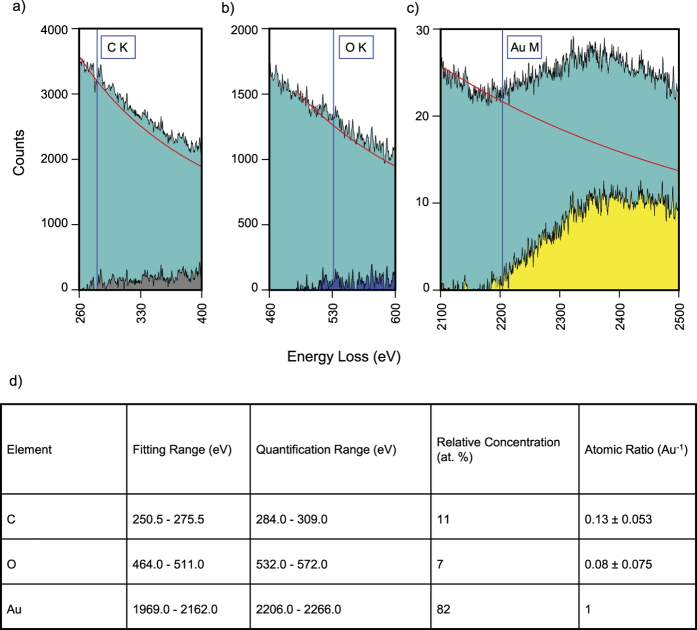
Figure 3. Detailed parts of the TEM EELS spectrum.
The acquired raw count is shown in green, the fitted exponential background is drawn in red, and the resulting background corrected signal is shown. The shown energy range in (c) is broader compared with (a,b) because of the delayed edge characteristic of the gold M signal. (d) EELS quantification results and parameters.

