Figure 5.
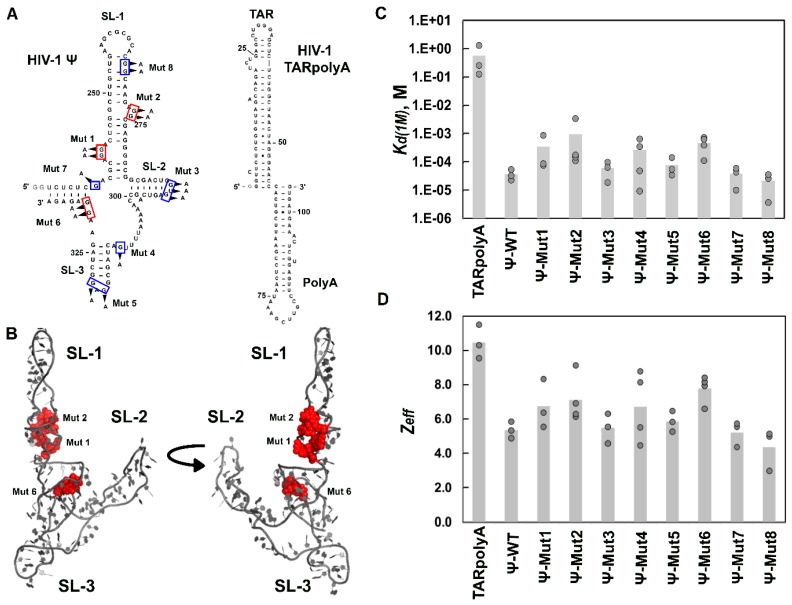
HIV-1 RNA constructs used in this work and salt-titration binding results with HIV-1 Gag∆p6. (A) Predicted secondary structures of HIV-1 Ψ (left) and HIV-1 TARpolyA (right) are shown. Eight mutant Ψ RNAs are indicated by the boxed nt and arrows (Mut1-Mut8). Additional 5’ G nt not present in the HIV-1 genome were added to facilitate in vitro transcription and are shown in gray; (B) The location of Mut 1, 2, and 6 mapped onto the all-atom model of HIV-1 Ψ previously determined from small angle x-ray scattering data and computational modeling [61]. Colors in (A) and (B) indicate mutations that had no effect on specificity (blue), and significant effects (red) based on salt-titration binding assays. Bar graphs of Kd(1M) values (C) and Zeff values (D) determined from salt-titration assays with HIV-1 Gag∆p6 and HIV-1 TARpolyA, Ψ RNA, and Ψ RNA mutants. Values of three or four trials performed in each case are shown with the height of the bar indicating the mean value.

