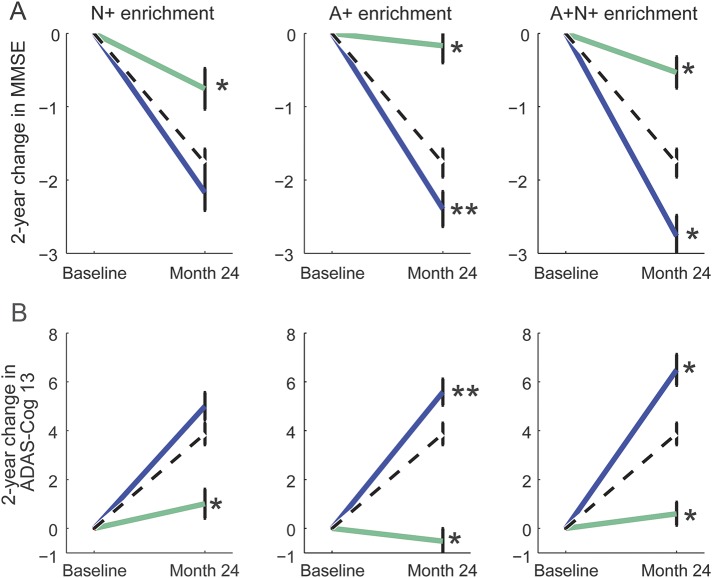
Figure 2. Time course graphs for different enrichment strategies.
Change in Mini-Mental State Examination (MMSE; A) and Alzheimer's Disease Assessment Scale Cognitive Subscale (ADAS-Cog 13; B) for the unenriched sample (dashed black line), enriched sample (solid blue line), and excluded sample (solid green line). Whiskers present SE. Significance of the difference between included and excluded groups and the unenriched sample is shown as **p < 0.05 and *p < 0.01. A+ = amyloid positive; N+ = neurodegeneration positive.

