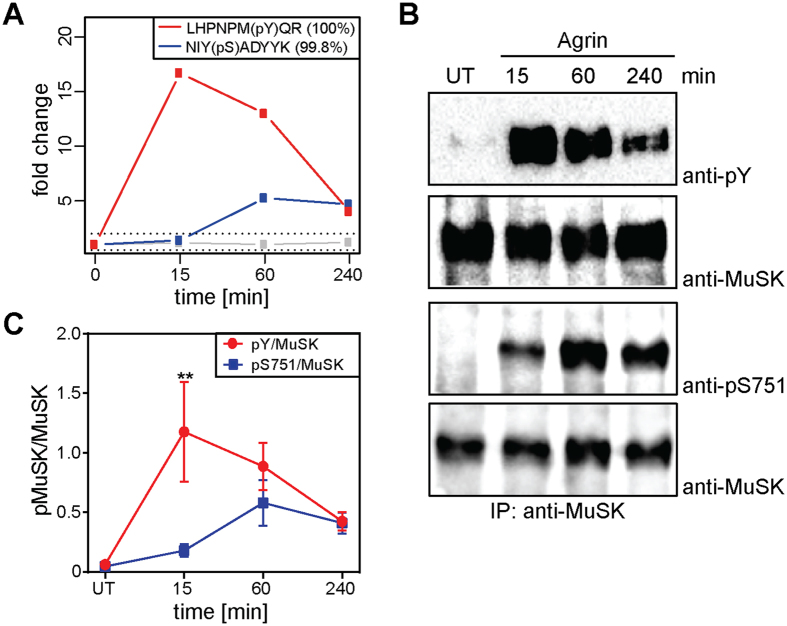
Figure 1. S751 is phosphorylated in response to agrin.
(A) Phosphopeptides were identified by quantitative MS analysis. Quantification of these showed induction of pY553 (red) and pS751 (blue) upon agrin treatment. In addition, phosphorylation of MuSK S678 was detected but not significantly regulated (grey). Phosphosites of regulated peptides were localized with high confidence (phosphoRS site probabilities are indicated in brackets). (B) Cell lysates from agrin-stimulated muscle cells were subjected to immunoprecipitation with anti-MuSK antibodies. Samples were analysed by immunoblotting using antibodies against phospho-tyrosine, phospho-S751 and MuSK. (C) Quantification of immunoblots shows phosphorylation kinetics similar to the kinetics of MS analysis. Values are presented as the mean ± S.E.M. (two-way ANOVA with Sidak’s multiple comparison tests, n = 5, p = 0.004). Full-length blots are presented in Supplementary Fig. S7. IP, immunoprecipitation; pY, phospho-tyrosine; UT, untreated.

