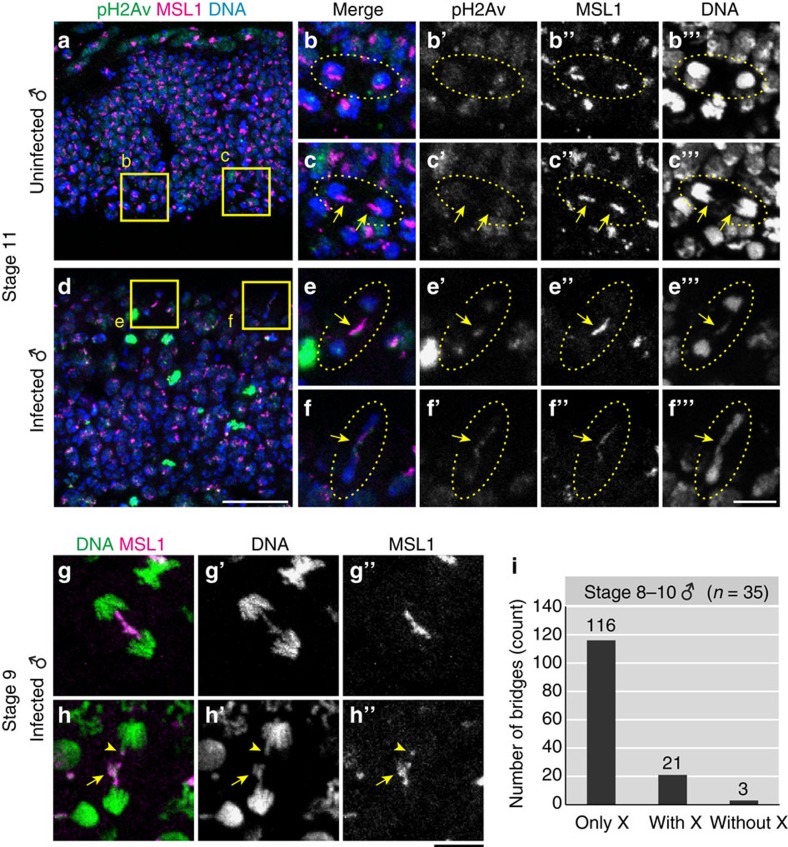
Figure 4. Bridge and breakage of the male X chromosome during mitosis.
(a) Epidermal cells of an uninfected male embryo at stage 11, in which pH2Av, MSL1 and DNA are visualized in green, magenta and blue as in Fig. 3a. (b,c) Magnified images of boxed regions in a, whose single-channelled images are shown in b′–b′′′ and c′–c′′′, respectively. Dotted circles highlight dividing cells in telophase. In b–b′′′, sister chromatids are normally segregating to daughter cells, whereas in c–c′′′, MSL1-labelled X chromatids seem to be segregating slightly slower than the other chromatids (arrows). (d) An image similar to a of a Spiroplasma-infected male embryo, exhibiting many pH2Av signals. (e,f) Magnified images of boxed regions in d, whose single-channelled images are shown in e′–e′′′ and f′–f′′′, respectively. Dotted circles highlight dividing cells in telophase, while arrows indicate inter-nuclear bridges overlapping with MSL1 and focal pH2Av signals, indicating that damaged male X chromatids constitute inter-nuclear bridges. (g,h) Two examples of anaphase chromatin bridges in infected male embryos at stage 9, wherein chromosomal DNA (green) and MSL1 representing X chromatids (magenta) are shown. Single-channelled images are shown in g′, g′′ and h′, h′′. Arrows and arrowheads in h–h′′ indicate an abnormally tangled DNA mass and asymmetrically segregated X chromatids, respectively. (i) Categorization of anaphase chromatin bridges in infected male embryos at stage 8–10. In total 140 anaphase bridges from 35 embryos were inspected. The categories ‘only X', ‘with X' and ‘without X' indicate complete, partial and no overlap between chromatin bridges and MSL1 signals. For more detail, see text. Scale bars, 20 μm (a,d) and 5 μm (b–c′′′, e–f′′′ and g–h′′).

