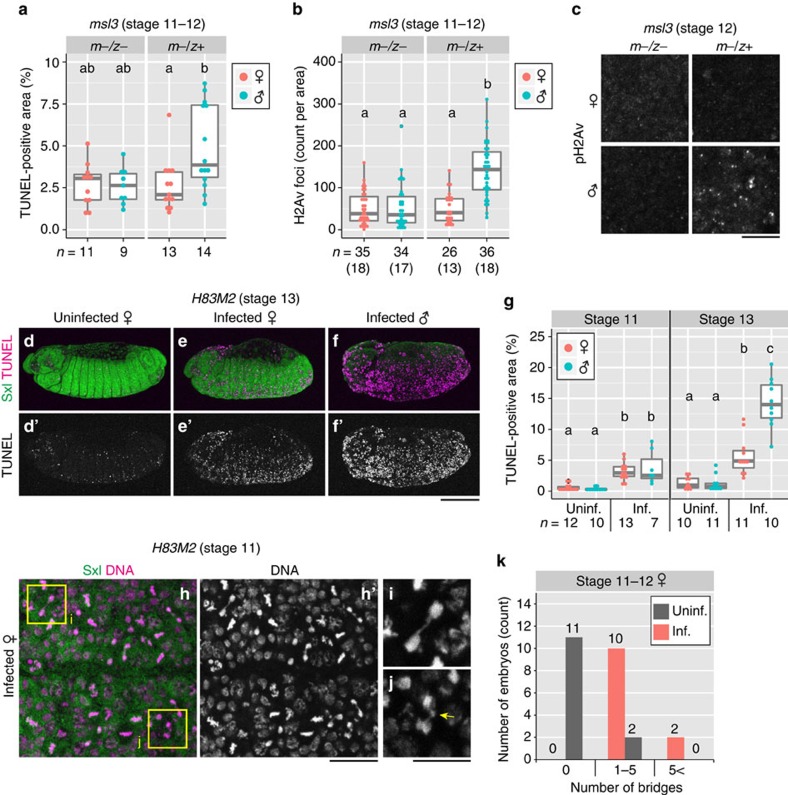
Figure 5. The MSL complex is necessary and sufficient for Spiroplasma-induced DNA damage and abnormal apoptosis.
(a–c) Apoptosis (a) and DNA damage (b,c) in Spiroplasma-infected male and female embryos of msl3 maternal–zygotic mutant (m−/z−; zygotic genotype msl31/msl31) and maternal mutant (m−/z+; zygotic genotype msl31/TM3 ActGFP). (a) Quantification of TUNEL-positive areas at stage 11–12. Different letters (a,b) indicate statistically significant differences (P<0.05; Kruskal–Wallis test followed by Mann–Whitney U-tests). (b) Quantification of focal pH2Av signals at stage 11–12. Different letters (a,b) indicate statistically significant differences (P<0.01; Kruskal–Wallis test followed by Mann–Whitney U-tests). (c) Focal pH2Av signals in msl3 mutant embryos at stage 12. (d–k) Ectopic MSL complex formation by the H83M2 transgene. (d) An uninfected H83M2 female embryo exhibiting little abnormal apoptosis. (e,f) Infected H83M2 embryos showing abnormal apoptosis (e, female; f, male). In d–f, stage 13 embryos are stained for Sxl (green) and TUNEL (magenta), whereas single-channelled TUNEL images are shown in d′–f′. (g) Quantification of TUNEL-positive areas in uninfected and infected H83M2 embryos at stage 11 (left) and 13 (right). Different letters (a–c) indicate statistically significant differences (P<0.01; Kruskal–Wallis test followed by Mann–Whitney U-tests). (h) Epidermal cells of an infected H83M2 female embryo at stage 11, stained for Sxl (green) and DNA (magenta), whereas single-channelled DNA image is shown in h′. (i,j) Enlarged images of dividing cells with a chromatin bridge (i) and an abnormally tangled DNA mass (j, arrow), representing boxed regions in h. (k) Quantification of chromatin bridges in the epidermal cells of uninfected and infected H83M2 female embryos at stage 11–12. The number of chromatin bridges per × 63 objective view are categorized into three classes: no bridge (0); 1 to 5 bridges (1–5); and 6 or more bridges (5<). In a, b and g, box plots are as in Fig. 2i,j. and sample sizes are indicated at the bottom. In b, numbers of embryos observed are shown in parentheses. Scale bars, 10 μm (c, i and j), 100 μm (d–f′) and 20 μm (h,h′).

