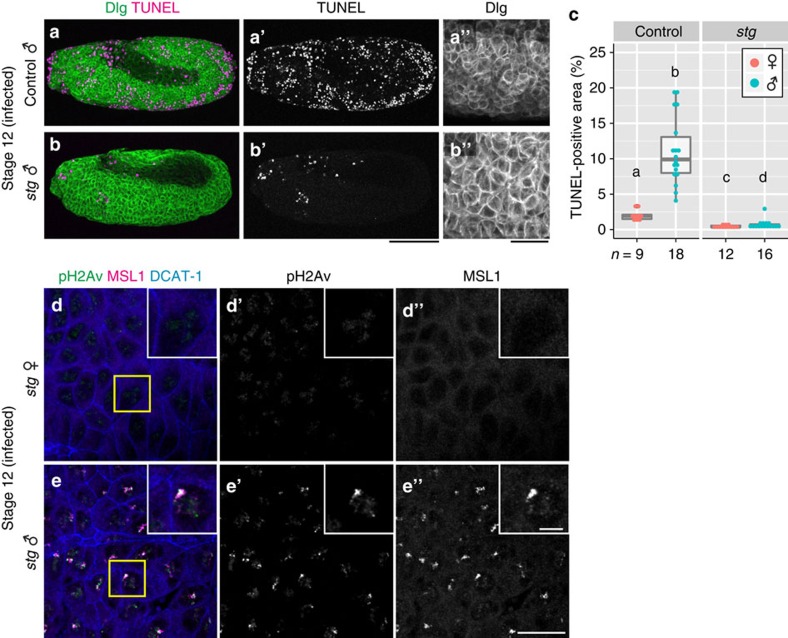
Figure 6. DNA damage and apoptosis in Spiroplasma-infected embryos mutant for stg.
(a,b) Spiroplasma-infected control male embryo (genotype stgAR2/TM3 or stg7B/TM3) and stg mutant male embryo (genotype stgAR2/stg7B) at stage 12. Cell membranes and apoptotic cells are visualized by anti-Discs large (Dlg; green) and TUNEL (magenta) staining, respectively. Single-channel images of TUNEL staining and high magnification images of Dlg staining are shown in a′–b′ and a′′–b′′, respectively. (c) Quantification of TUNEL-positive areas in infected control and stg mutant embryos. Box plots are as in Fig. 2i,j. Different letters (a–d) indicate statistically significant differences (P<0.05 for stg females versus males, P<0.01 for the others; Kruskal–Wallis test followed by Mann–Whitney U-tests). Sample sizes are indicated at the bottom. (d,e) Infected stg mutant female (n=7) and male (n=11) embryos at stage 12, in which DNA damage (pH2Av; green), the X chromosome (MSL1; magenta), and cell membrane (DCAT-1; blue) are visualized. Single-channel images of pH2Av signals and MSL1 signals are shown in d′–e′ and d′′–e′′, respectively. Boxed regions in d and e are magnified in insets of d–d′′ and e–e′′. Scale bars, 100 μm (a–b′), 25 μm (a′′,b′′), 20 μm (d–e′′) and 5 μm (insets in d–e′′).

