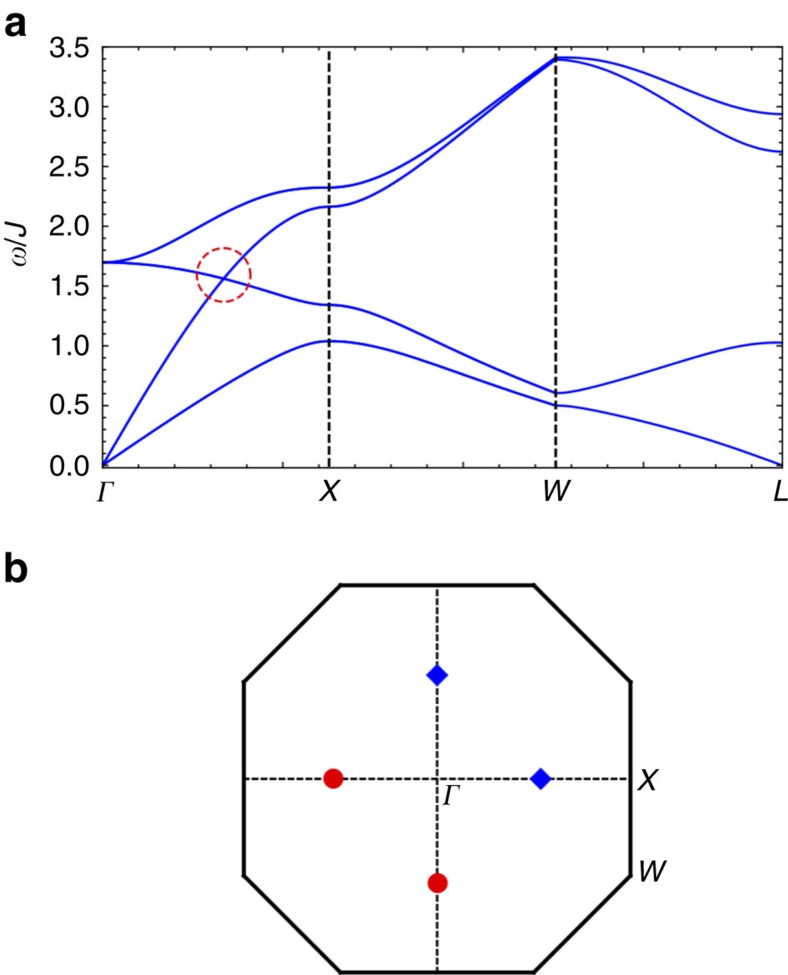
Figure 3. The representative spin-wave spectrum and the Weyl nodes of region I.
(a) The spin-wave spectrum along high-symmetry momentum lines with a linear band touching that is marked with a (red) dashed circle. (b) Four Weyl nodes are located at (±k0, 0, 0), (0, ±k0, 0) with k0=1.072π in the xy plane of the Brillouin zone. The (red) circle has an opposite chirality from the (blue) diamond. In the figure, we have set D=0.2J, J′=0.6J and θ=π/2.

