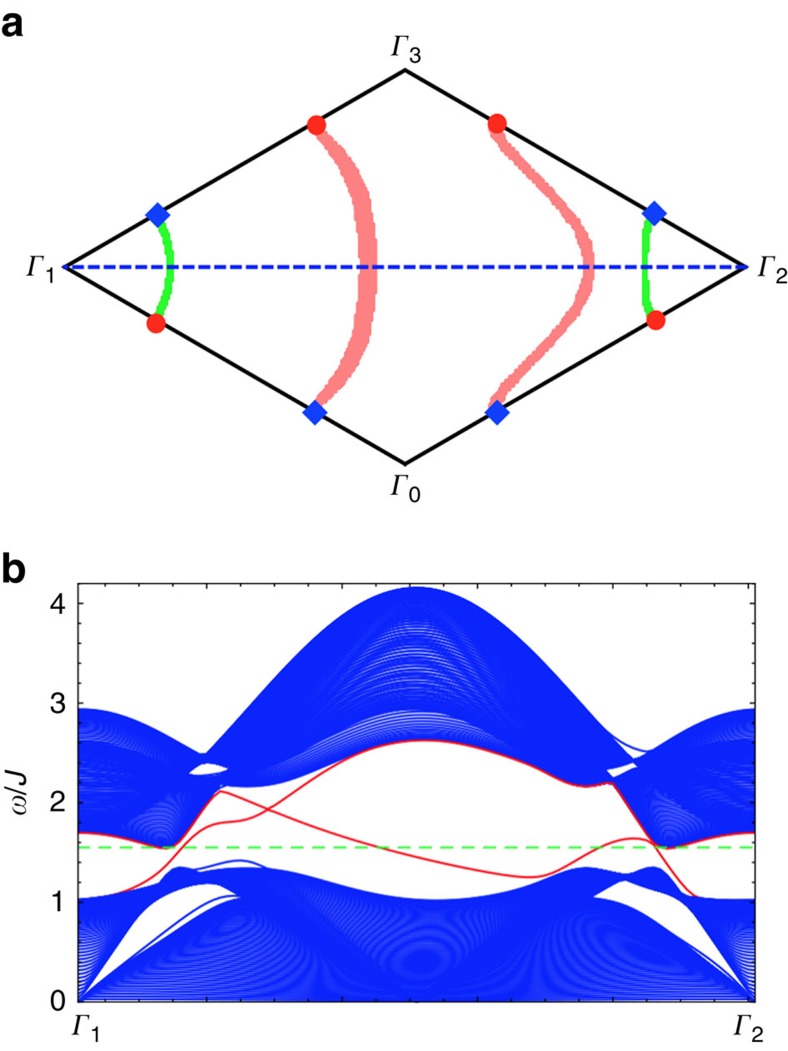
Figure 4. Surface states of a slab.
The slab is cleaved along the [11 ] surface, setting D=0.2J, J′=0.6J and θ=π/2. (a) Magnon arcs in the surface Brillouin zone. Γ0 is the origin of the Brillouin zone and two reciprocal lattice vectors are
  ,
,  . The surface states with E=EWeyl form arcs connecting the Weyl nodes with different chiralities, where EWeyl is the energy of the bulk Weyl nodes. States along the two pink longer (green shorter) arcs are localized in the top (bottom) surface. (b) The (blue) bulk magnon excitations and the (red) chiral surface states along
  . The (green) dashed line indicates E=EWeyl.

