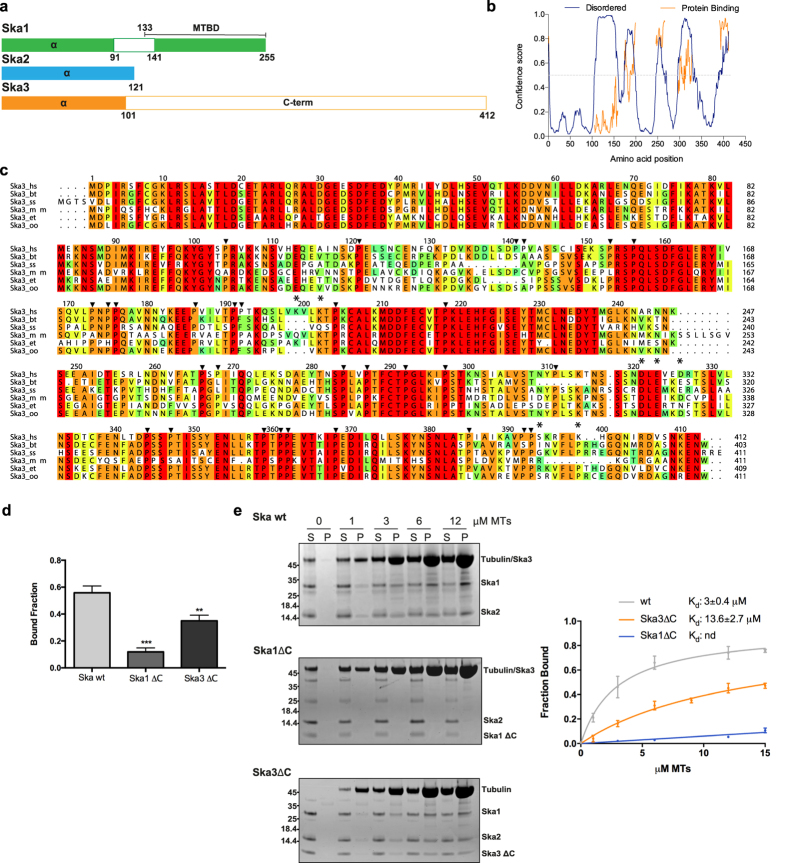
Figure 1. The intrinsically disordered C-terminal domain of Ska3 contributes to the microtubule binding activity of the Ska complex.
(a) Domain architecture of the Ska components where filled boxes represent structured regions. MTBD: MicroTubule Binding Domain of Ska1 (residues from 133 to 255). (b) Predicted disordered and protein-binding regions of Ska3 using Disopred (http://bioinf.cs.ucl.ac.uk/psipred). Blue: predicted disordered residues, Orange: predicted protein-binding residues. (c) Amino acid conservation of Ska3 (conservation score is mapped from red to cyan, where red corresponds to highly conserved and cyan to poorly conserved). The alignments include orthologs from H. sapiens (hs), Bos taurus (bt), Sus scrofa (ss), Mus musculus (mm), Echinops telfairi (et), Orcinus orca (oo). Ska3 residues evaluated in this study are marked with asterisks. Multiple sequence alignment was performed with MUSCLE (MUltiple Sequence Comparison by Log-Expectation, EMBL-EBI) and edited with Aline35. (d) Quantification of MT-cosedimentation assay comparing the microtubule-binding activity of the wt Ska complex, Ska1ΔC and Ska3ΔC. Concentrations used in the assay: 1 μM protein, 9 μM MTs (mean ± s.d., n = 3, **P ≤ 0.01, ***P ≤
 0.001; t-test). (e) Left, Representative SDS-PAGE of MT-cosedimentation assays comparing the microtubule-binding activity of the wt Ska complex, Ska1ΔC and Ska3ΔC. Right, Microtubule-binding curve for the wt Ska complex, Ska1ΔC and Ska3ΔC. Kd values were calculated using 1 μM Ska and 0–15 μM MTs (mean ± s.d., n = 4).

