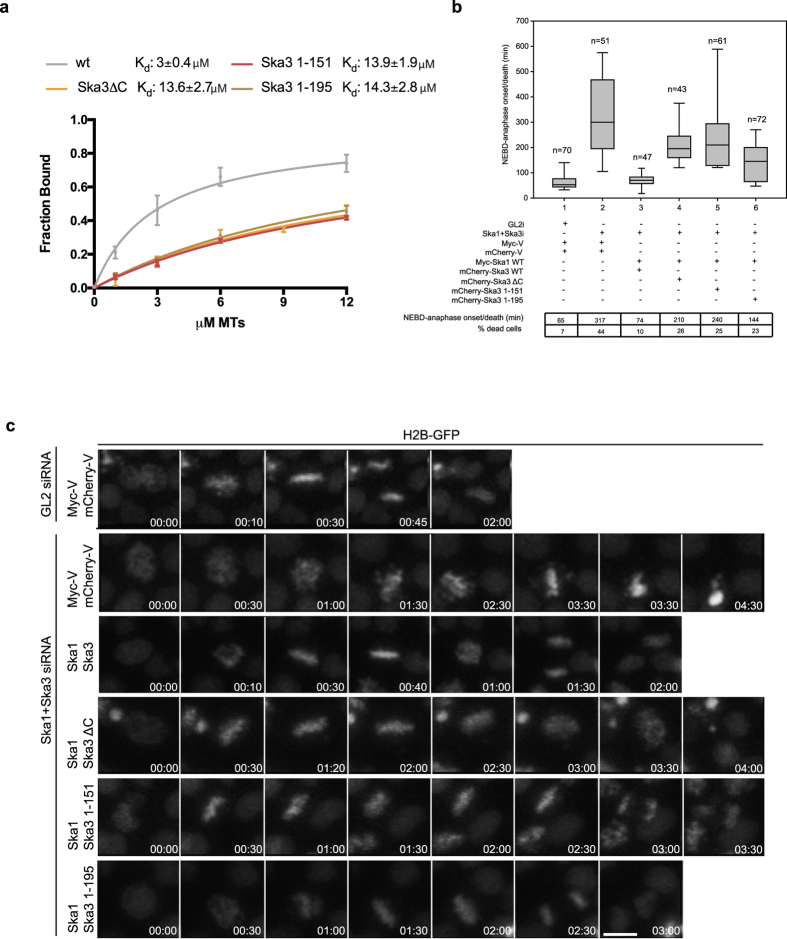
Figure 2. The C-terminal domain of Ska3 is required for timely mitotic progression.
(a) Quantification of MT-cosedimentation assays comparing the wt Ska complex and Ska1-Ska2-Ska3ΔC with Ska1-Ska2-Ska31–151 and Ska1-Ska2-Ska31–195. Kd values were calculated using 1 μM Ska and 0–12 μM MTs (mean ± s.d., n = 4). (b) Box-and-whisker plot showing the elapsed time (min) between nuclear envelope breakdown (NEBD) and anaphase onset/death for individual cells. The number of cells (n) from three independent time-lapse experiments is given above each box. Lower and upper whiskers represent 10th and 90th percentiles, respectively. Below, table summarizing information from the live cell experiments regarding the average time between NEBD to anaphase onset/death and the percentage of cells dying in mitosis. Myc-V and mCherry-V were used as transfection controls. (c) Representative stills from time-lapse video-microscopy experiments illustrating mitotic progression of HeLa S3 cells stably expressing histone H2B-GFP treated as in (b). Time in hr:min is indicated. T = 0 was defined as the time point where NEBD became evident. Scale bar, 10 μm.

