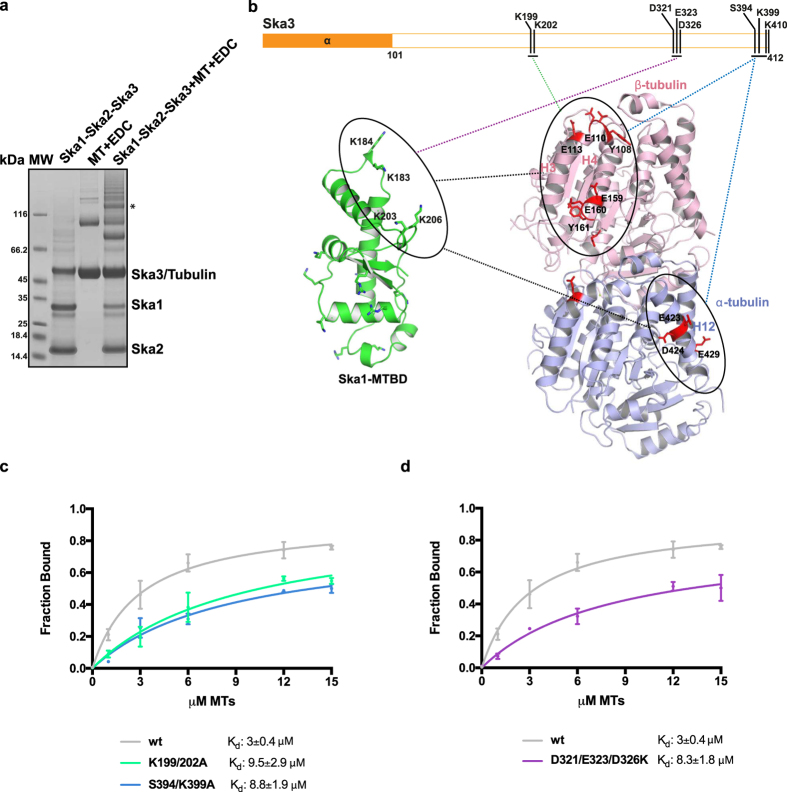
Figure 3. Ska3 directly interacts with tubulin monomers and Ska1-MTBD.
(a) Representative SDS-PAGE of 6 μM Ska complex cross-linked to 10 μM microtubules with EDC. The band analyzed in this study is marked with an asterisk. (b) Cartoon representation of tubulin dimer (pink: β-tubulin, blue: α-tubulin) where residues involved in cross-linking with Ska3 (orange) and Ska1-MTBD (green) are shown in stick representation. Green, blue and purple lines indicate cross-links observed between Ska3 K199/K202 and β-tubulin, Ska3 S394/K399 and α- and β- tubulin, and Ska3 D321/E323/D326 and Ska1, respectively. (c) Microtubule-binding curves of the wt Ska complex (grey) and Ska3 microtubule-binding mutants (K199/202A and S394/K399A; green and blue respectively). Kd values were calculated using 1 μM Ska and 0–15 μM MTs (mean ± s.d., n ≥ 4). (d) Microtubule-binding curve of the wt Ska complex (grey) and Ska1-binding inefficient Ska3 mutant (D321/E323/D326K, purple). Kd values were calculated using 1 μM Ska and 0–15 μM MTs (mean ± s.d., n ≥ 4).

