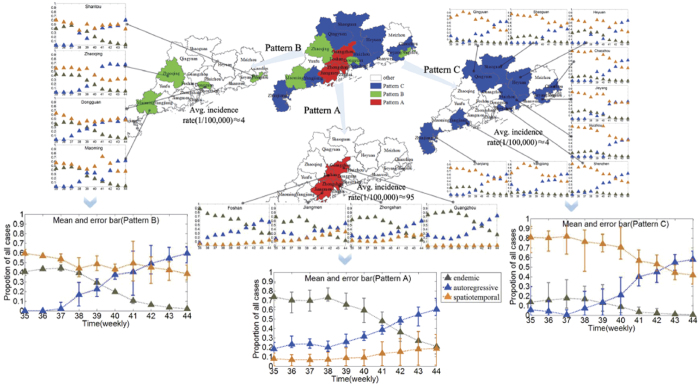
Figure 7. Three patterns and their characteristics.
The autoregressive component trends are similar, and their percentages increase in all districts during the dengue outbreak period. In addition, red districts (Jiangmen, Zhongshan, Guangzhou and Foshan, Pattern A) have been mainly affected by the endemic component and are also the ones with the highest overall number of cases. Green districts (Maoming, Dongguan, Zhaoqing and Shantou, Pattern B) are mainly influenced by endemic and spatiotemporal components in the early period, and then the endemic proportion declines gradually, but the spatiotemporal proportion always maintains a relatively high level. The spatiotemporal component of incidence is the most powerful in blue districts (Chaozhou, Shaoguan, Huizhou, Jieyang, Heyuan, Shenzhen, Zhanjiang, Qingyuan and Yangjiang, Pattern C), meaning that a great number of cases are explained via transmission from neighboring districts (created with ArcGis Professional software version 10.2, http://www.esri.com/).

